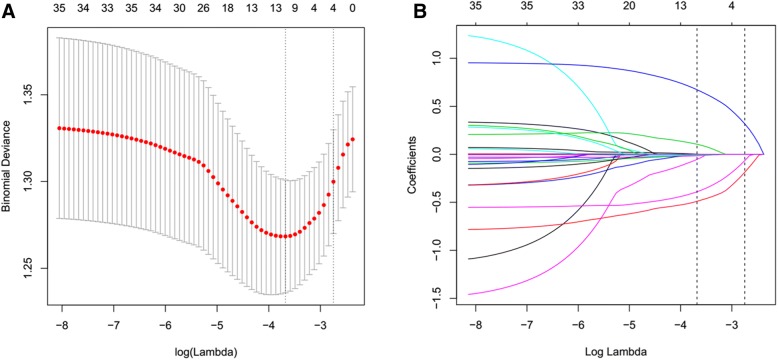
Fig. 1.
The strength of association between variables with EBB-induced bleeding in the LASSO regression method. a Tuning variable (lambda) selection using 10-fold cross-validation in the LASSO regression. Dotted vertical lines were drawn at the optimal values based on the minimum criteria (left dotted line) and the 1-SE criteria (right dotted line). b A coefficient profile plot was produced against the log (lambda) sequence. In the current study, variables were filtered according to the minimum criteria (left dotted line), where optimal lambda resulted in 7 nonzero coefficients, including HDL-C (− 0.0527), APTT (− 0.0146), neutrophils (0.0024), CRP (0.0015), lesion location (0.6728), TNM stage (− 0.3905) and histological types (− 0.4902). SE = standard error

