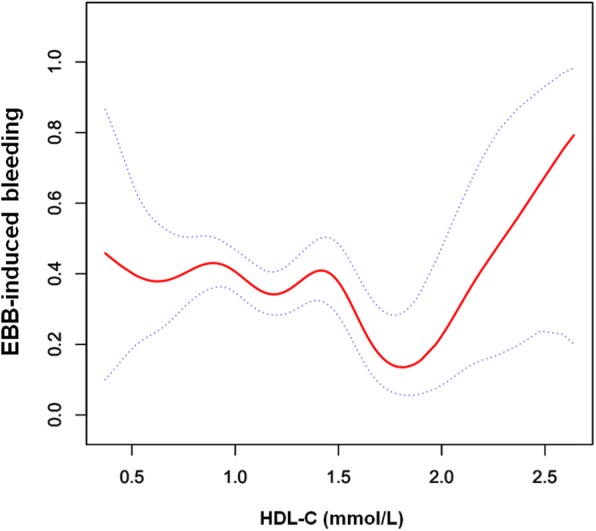
Fig. 2.

A non-linear relationship with threshold effect between plasma HDL-C concentrations and EBB-induced bleeding risk in the smooth curve fitting after adjusting the potential confounding factors (sex, age, smoking, location of lesion, histological type, stage of cancer, triglyceride, apolipoprotein E, PT, APTT, neutrophils and CRP) is shown in the figure. Dotted lines represent the upper and lower 95% confidence intervals. EBB = endobronchial biopsy; HDL-C = high density lipoprotein cholesterol; PT = prothrombin time; APTT = activated partial thromboplastin time; CRP = C-reactive protein
