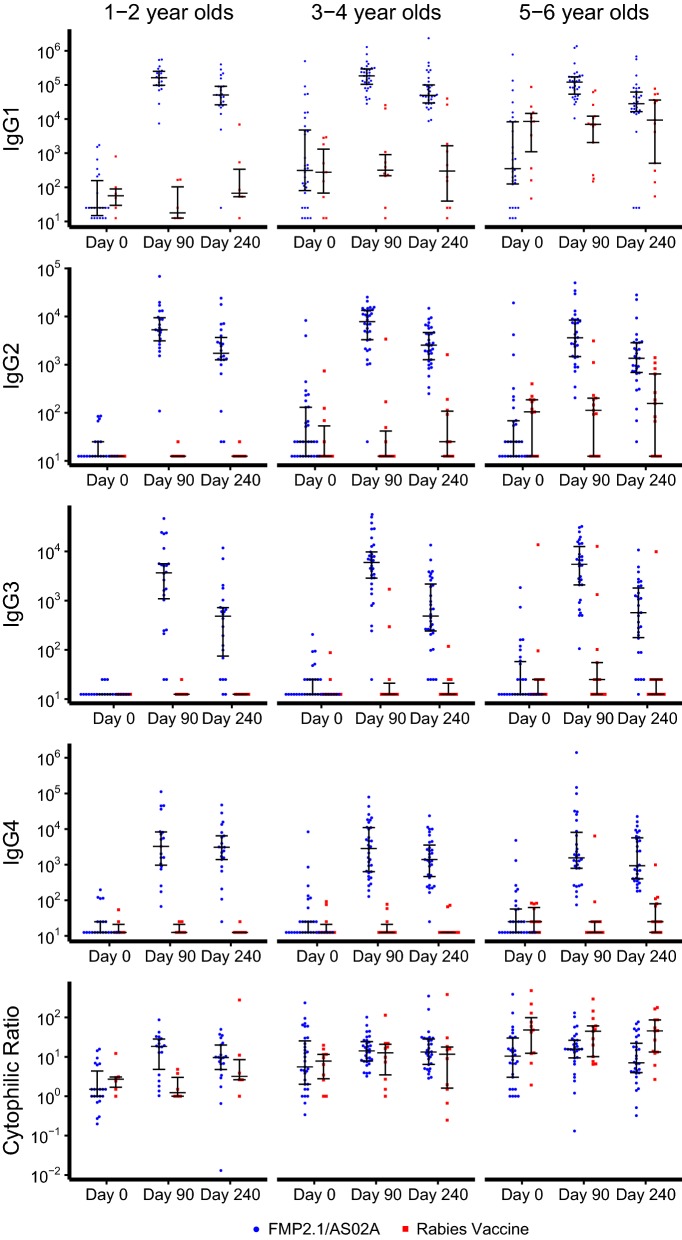
Fig. 2.
IgG subclass titers and cytophilic ratios across three age strata. IgG subclass titers for vaccine recipients (blue) and control subjects (red) with geometric mean titers and 95% confidence intervals at day 0, 90, and 240, grouped by age strata. Vaccinations were administered on days 0, 30, and 60. Cytophilic ratios were calculated as the sum of the IgG1 and IgG3 titers divided by the sum of the IgG2 and IgG4 titers

