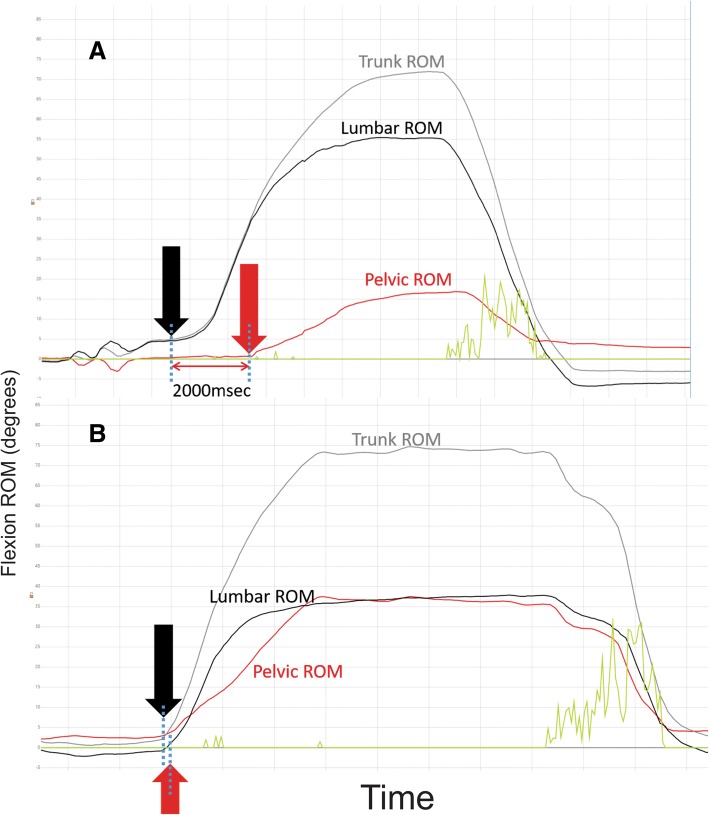
Fig. 3.
Delay (lag) of pelvic compared to lumbar movement. These graphs show ROM (Y axis) changes over time (X axis). Graph a was from a subject who moved their lumbar spine into flexion with a two second delay before the pelvis started moving. Graph b shows a more typical pattern with a synchronous start of movement of the lumbar spine and pelvis

