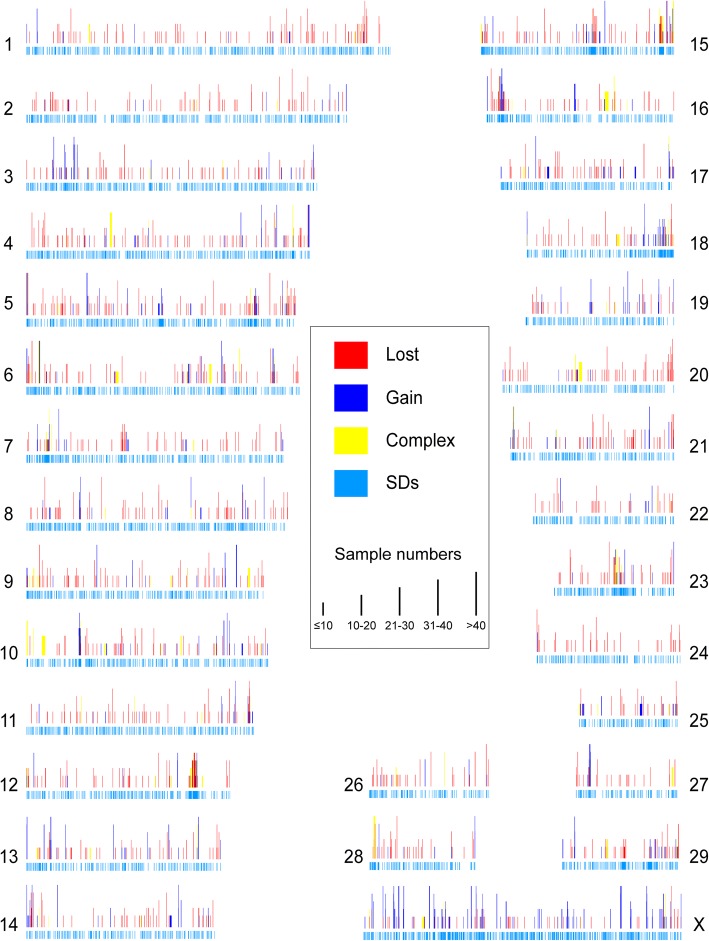
Fig. 2.
Genomic landscape of CNVRs and SDs in yak. The SDs are plotted as light blue bars. The CNVRs are illustrated above the SDs in rad (loss), navy blue (gain) and yellow (complex of gains and losses). The chromosome numbers (1–29, X) are shown nearby correspond CNV landscape, and the bar height represents different sample numbers (≤10、10–20、21–30、31–40、 > 40)

