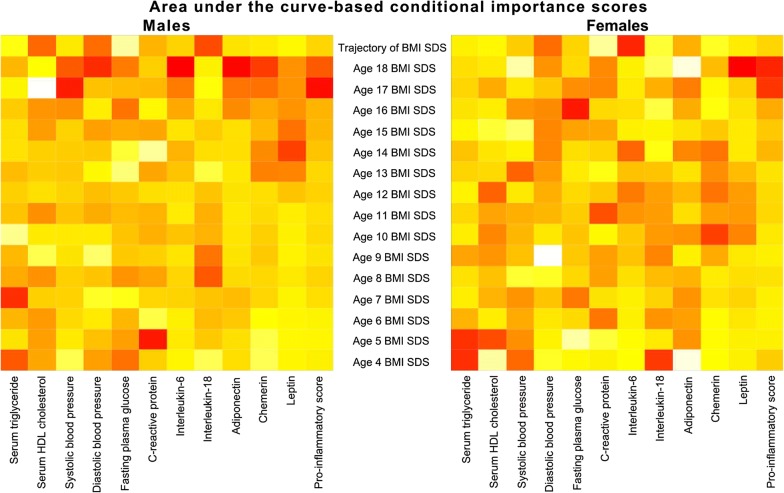
Fig. 3.
Heat maps showing the area under the curve-based conditional importance scores determined by random forest for males (left) and females (right) for BMI SDS trajectory relative to BMI SDS at specific ages for cardiometabolic risk markers in late adolescence–young adulthood. The colour order of magnitude of the importance scores is from yellow→orange→red (highest values are in red and lowest values are in yellow). BMI SDS body mass index standard deviation scores. Analysis performed on transformed cardiometabolic risk markers. Transformation (exponents) were: In males, triglycerides, IL-6 and leptin were transformed by natural logarithm; HDL-c by square root; pro-inflammatory score by cube root; adiponectin by fourth root; SDP, CRP, and chemerin by inverse of fourth root; DBP and FPG by cube of fourth root; and IL-18 by inverse of the cube of fourth root. In females, triglycerides, CRP, adiponectin, and leptin were transformed by natural logarithm; HDL-c and chemerin by square root, pro-inflammatory score by cube root; DBP by cube of square root; and SBP, FPG, IL-6, IL-18 by inverse of fourth root

