
Fig. 6.
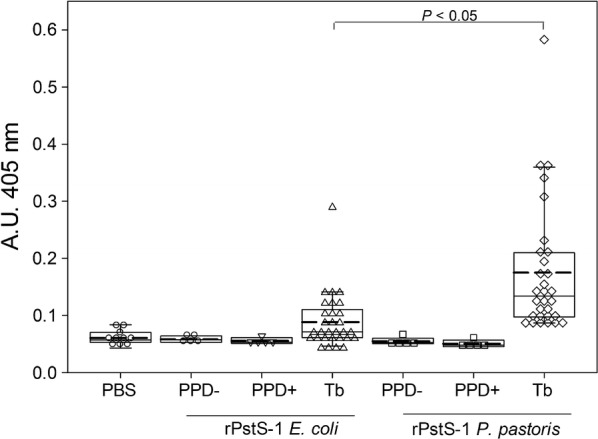
Box plot analysis of antibody reactivity to recombinant antigens rPstS-1. Recombinant proteins (from E. coli and P. pastoris) were tested with PPD-negative (n = 5), PPD-positive sera (n = 5) at 1:100 and active-TB sera (n = 30) at 1:500 dilution. The reactivity is reported as difference of the absorbance units observed for the different group of sera by ELISA using a IgG2 conjugated with AP. Different sera of each group were tested by duplicate. Mean (dashed lane), median, 10th, 25th, 75th and 90th percentiles as vertical boxes with error bars are shown. Dunn´s test ws used for all pairwise comparisons and comparisons against a control group (PBS) following rank-based ANOVA