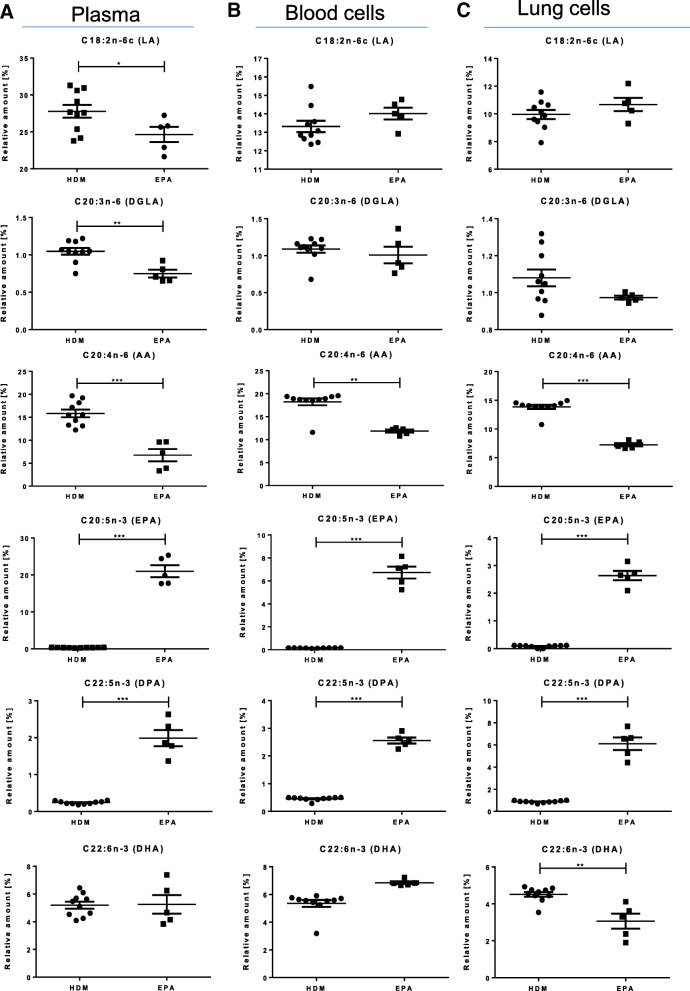
Fig. 3.
EPA supplementation could not completely reverse disease-specific LCPUFA alterations (Comparison: HDM vs. EPA). Relative amounts of n- 3 and n-6 fatty acids LA, DGLA, AA, EPA, DPA and DHA in (a) murine plasma (b) blood cells and (c) lung cells regarding asthmatic (HDM) and EPA supplemented asthmatic (EPA) mice on day 35. Data is represented by mean ± SEM out of n = 5–10 for each group. Statistical tests were performed by using One-Way ANOVA with Dunnet’s post-hoc analysis against the disease group (HDM) to statistically compare the results of all four treatment groups (PBS, HDM, EPA and sc-LCPUFA) shown in this article. P-Values were considered as statistically significant *P < 0.05, **P < 0.01, ***P < 0.001

