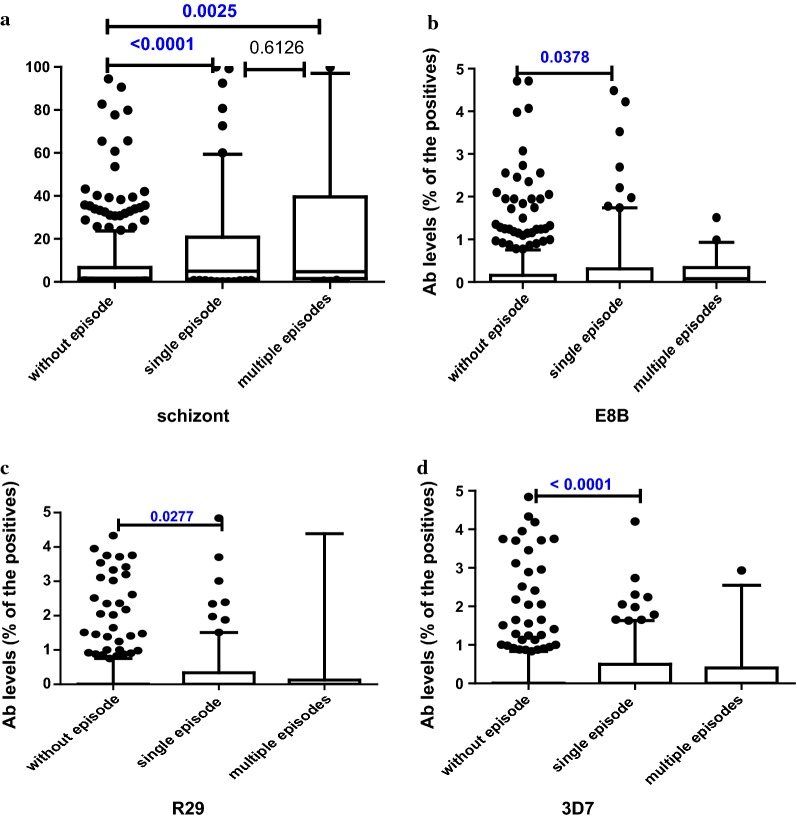
Fig. 2.
Levels of antibody at 18 months for a schizont extract, b E8B, c R29 and d 3D7 parasite line, by history of episodes of malaria; (N; Without episode = 457, Single episode = 119, Multiple episodes = 25). Data presented as box plots with the Y axis representing antibody levels as a percentage of positive control (pooled plasma of malaria immune adults). The boxes denote the 25th to 75th percentile while the whiskers denote the 10th and the 90th percentile with outliers. p value calculated using Mann–Whitney test between the two groups indicated by the line

