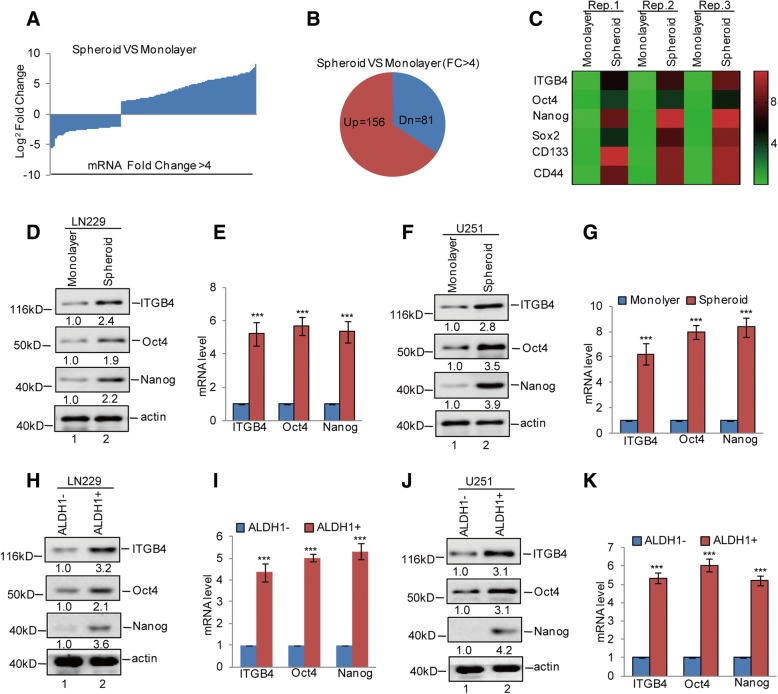
Fig. 1.
ITGB4 expression was increased in GSCs. a-c GSC-enriched populations were obtained from LN229 cells by sphere formation assay. The altered genes between spheroid and monolayer were detected by RNA sequencing analysis. The upregulated genes are listed. d-g The expression levels of ITGB4, Oct4, and Nanog were analysed by western blotting and q-RT-PCR assays. Data represent the mean ± SD of three independent experiments. *** p < 0.001 vs. control. h-k ALDH1 positive cells were obtained from LN229 and U251 cells by flow cytometry sorting. The expression levels of ITGB4, Oct4, and Nanog were analysed by western blotting and q-RT-PCR assays. Data represent the mean ± SD of three independent experiments. *** p < 0.001 vs. control

