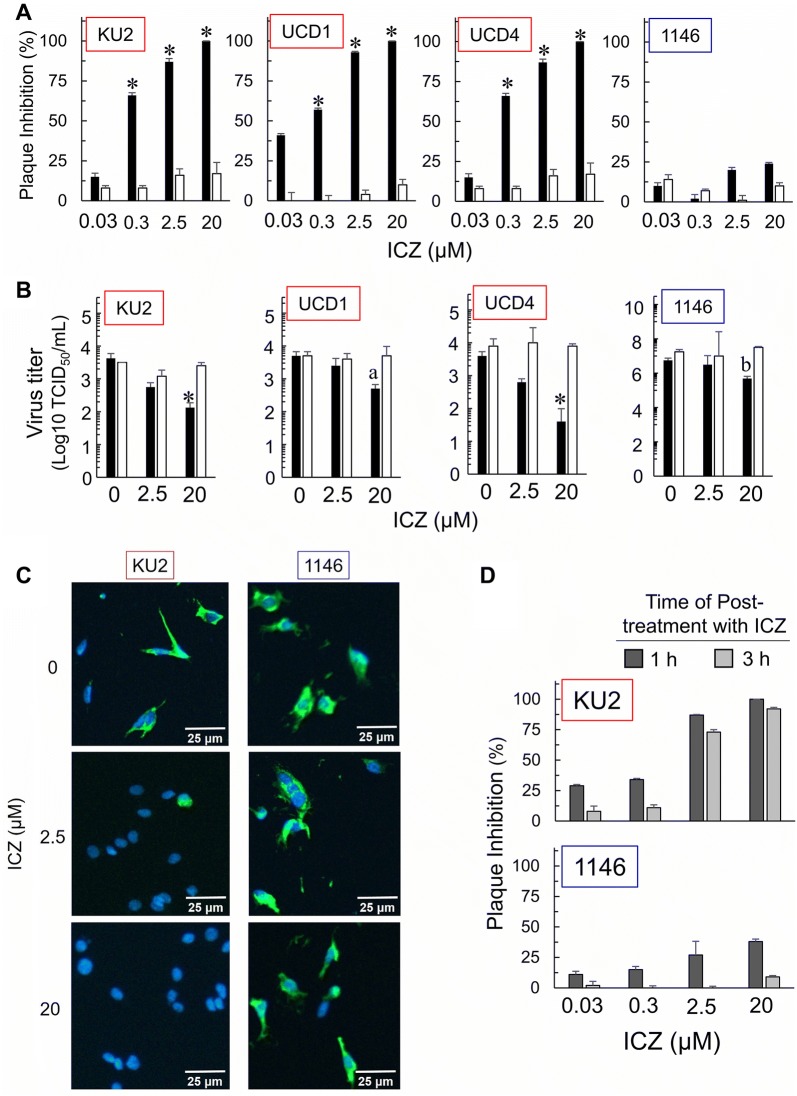
Figure 2.
Antiviral effects of ICZ on type I FIPV, and type II FIPV. A Plaque inhibition assay of FCoV in fcwf-4 cells treated with ICZ. The black bars indicate treatment with ICZ and the white bars indicate treatment with the solvent (solvent control). The results are shown as the mean ± SE. Data represent four independent experiments. *p < 0.05 v.s. solvent control. B Inhibition of FCoV infection by ICZ in fcwf-4 cells. The black bars indicate treatment with ICZ and the white bars indicate treatment with the solvent (solvent control). The results are shown as the mean ± SE. Data represent four independent experiments. *p < 0.05 v.s. solvent control. a: p = 0.054 v.s. solvent control. b: p = 0.082 v.s. solvent control. c: p = 0.052 v.s. solvent control. C Effects of ICZ on FCoV nucleocapsid (N) expression. FCoV N protein was evaluated by IFA. Data represent three independent experiments. D Effects of post-treatment on the antiviral activity of ICZ. KU2: FIPV-I KU2 strain, UCD1: FIPV-I UCD1 strain, UCD4: FIPV-I UCD4 strain, 1146: FIPV-II WSU 79-1146 strain, ICZ: itraconazole.

