Fig. 2.
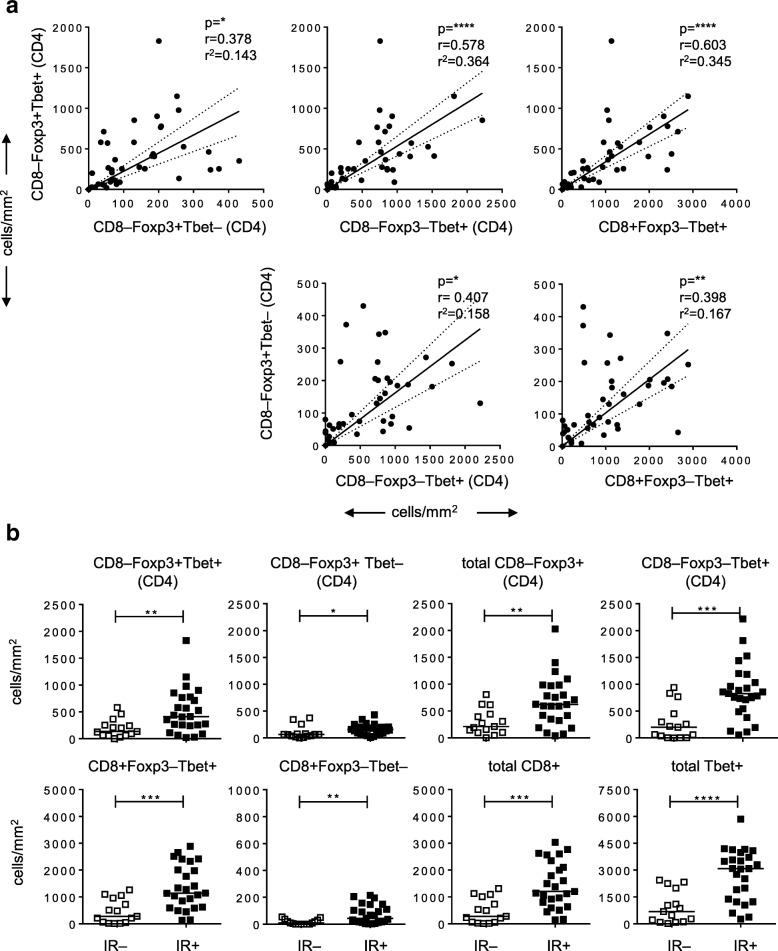
Foxp3+Tbet+ Tregs are attracted to Th1-oriented OPSCC tumors. a Scatter plots with correlation analysis between the number of CD8–Foxp3+Tbet+ cells and CD8–Foxp3+Tbet–, CD8–Foxp3–Tbet+ (CD4) and CD8+Foxp3–Tbet– cells (top) and between the number of CD8–Foxp3+Tbet– cells and CD8–Foxp3–Tbet+ (CD4) and CD8+Foxp3–Tbet cells (bottom). Pearson’s correlation with the correlation coefficient (r), the coefficient of determination (r2) and p-value is depicted for each correlation analysis. The dotted lines represent the 95% confidence interval. b Scatter plots depicting (from left to right) CD8–Foxp3+Tbet+, CD8–Foxp3+Tbet–, total CD8–Foxp3+, CD8–Foxp3–Tbet+ (all CD4; top), CD8+Foxp3–Tbet+, CD8+Foxp3–Tbet–, total CD8+ and total Tbet+ (CD4 and CD8; bottom) T cell infiltrates/mm2 in 15 immune response-negative (IR–; open squares) and 26 IR+ (closed squares) OPSCC patients. Data for CD8–Foxp3–Tbet+ and CD8+Foxp3–Tbet+ T cells have been described before [16]. * p < 0.05, ** p < 0.01, *** p < 0.001 and, **** p < 0.0001

