Fig. 4.
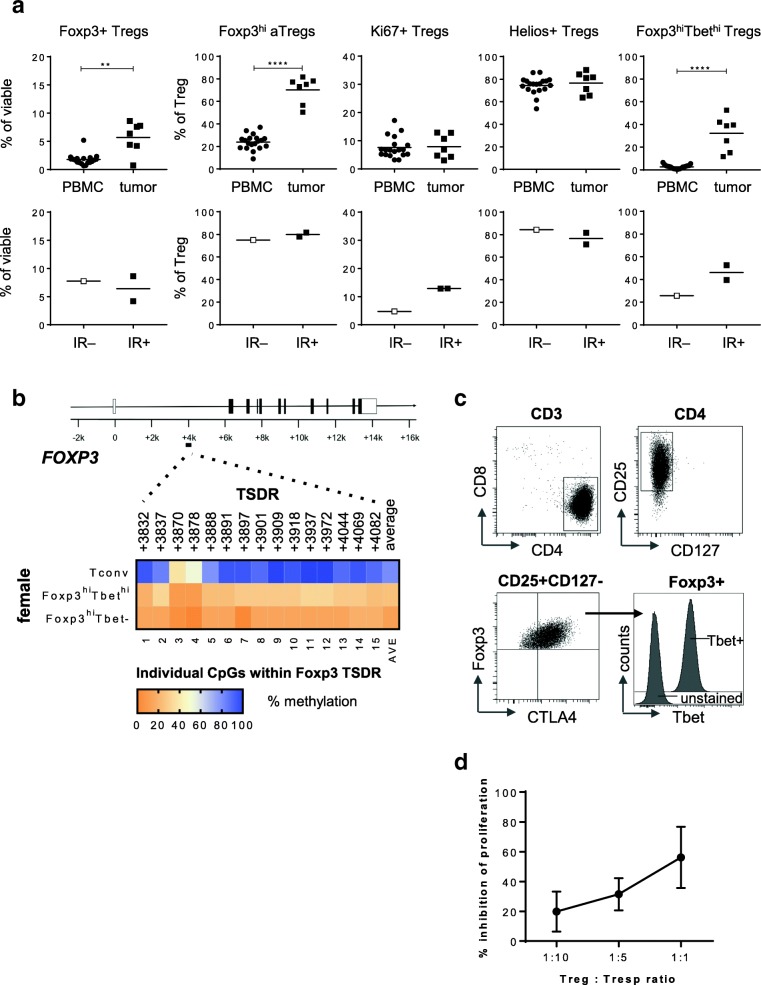
Foxp3hiTbethi Tregs accumulate in CxCa tumors with an ongoing type 1 immune response. Freshly dissociated CxCa tumor tissue was analyzed by 12-parameter flow cytometry analysis with antibodies directed against CD3, CD4, CD8, CD25, CD127, Foxp3, CD45RA, Ki67, Helios, CTLA-4 and Tbet. a Scatter plots displaying the percentage of CD4+CD25+CD127–Foxp3+ Tregs as percentage of viable cells, and the percentage of Foxp3hiCD45RA– activated Tregs (Foxp3hi aTregs), and Ki67+, Helios+ and Foxp3hiTbethi Tregs of percentage CD4+CD25+CD127–Foxp3+ Treg within CxCa PBMC (closed circles) and tumor (closed squares; top panel) and within immune response-negative (IR–; open squares) and IR+ (closed squares; bottom panel) CxCa tumors. * p < 0.05, ** p < 0.01, *** p < 0.001 and, **** p < 0.0001. b Heat map plots displaying the methylation percentages of the individual CpG sites within the Foxp3 Treg cell-specific demethylated region (TSDR) and the average of the 15 CpG sites for Tconv, Foxp3hiTbethi and Foxp3hiTbet– cells from a female CxCa donor. Percentage methylation is depicted in de color-code as depicted in the legend. Treg cells are partially demethylated in the female donor due to X-inactivation. c FACS plots depicting the CD25, CD127, Foxp3, CTLA4 and Tbet expression in the CD4+Foxp3hi Treg clone C148.31, which was derived from an HPV16+ cervical patient with an ongoing local type 1 immune response [26]. In the right bottom graph, an histogram overlay of Tbet over unstained control is depicted. d Graph showing percentage inhibition of responder T cell (Tresp) proliferation by the C148.31 CD4+Foxp3hi Treg clone at 1:10, 1:5 and 1:1 Treg: Tresp ratios. Mean and SD of three independent tests

