Fig. 4.

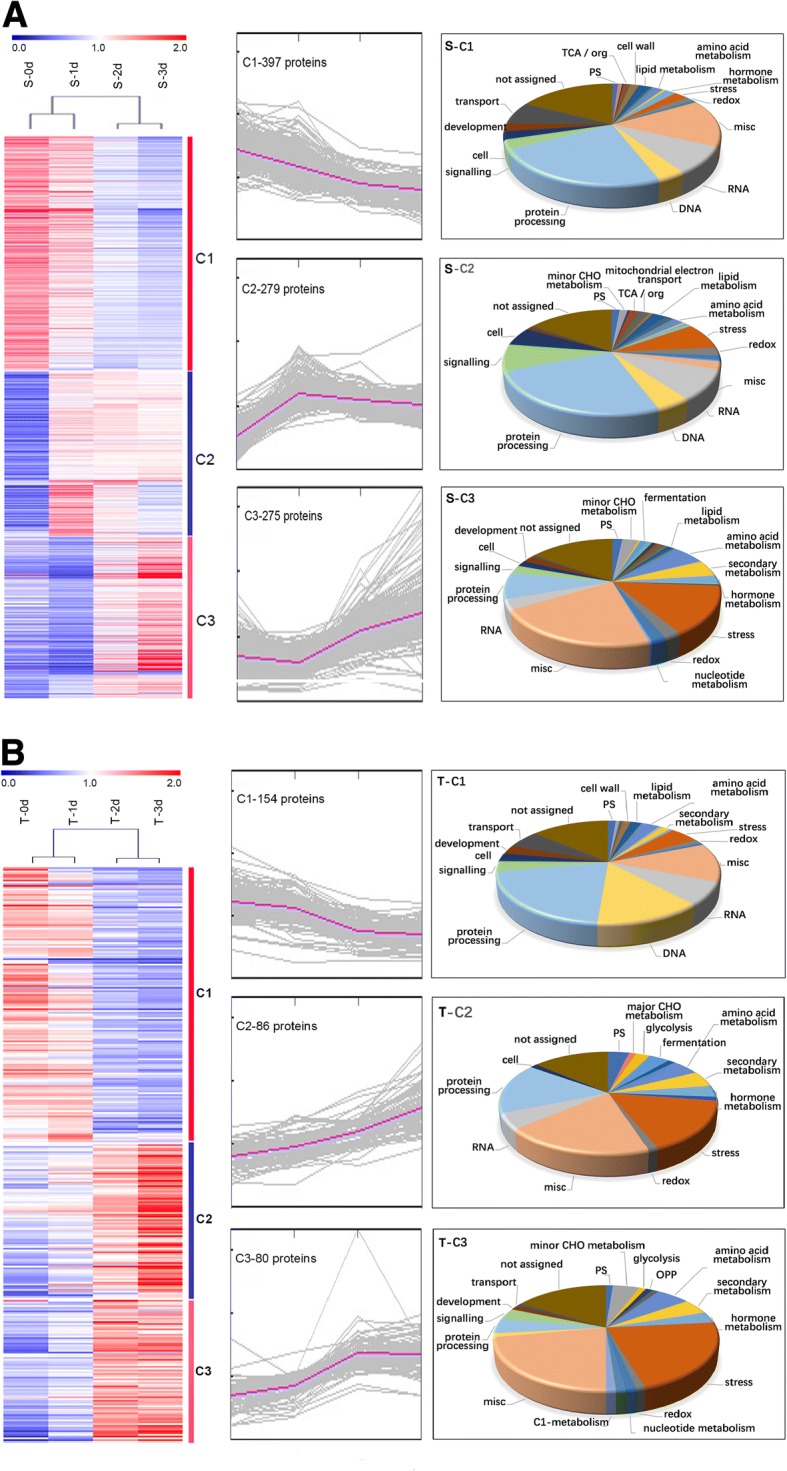
Clustering and the function classification of the DEPs. (a) S variety; (b) T variety. Left, central and right panels show the hotmap, K-means clustering and Mapman functional classification, respectively

Clustering and the function classification of the DEPs. (a) S variety; (b) T variety. Left, central and right panels show the hotmap, K-means clustering and Mapman functional classification, respectively