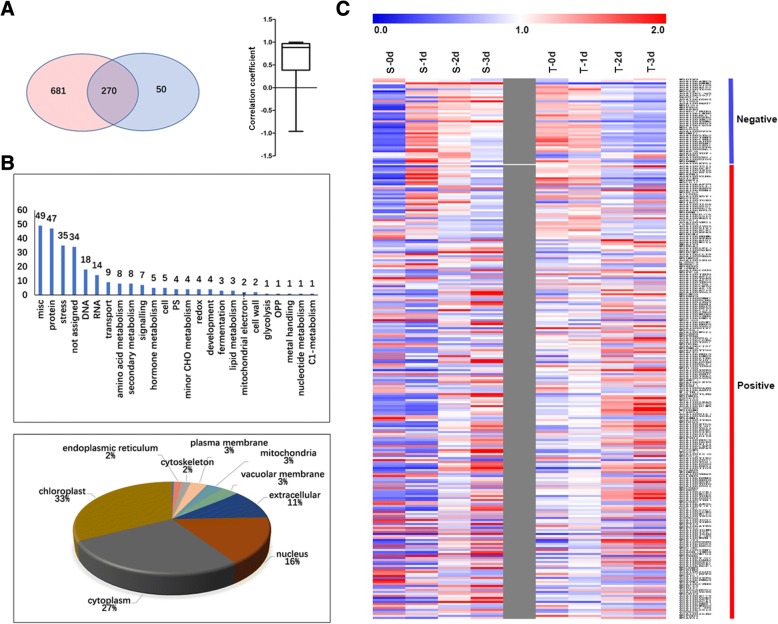
Fig. 5.
Comparison of common DEPs in S and T varieties. (a) Venn diagram of the DEPs between S (left) and T (right) varieties, and the correlation coefficient between the accumulation of the shared DEPs from the two varieties (right panel). (b) Function classification (Up) and subcellular location of the shared DEPs (Down). (c) Hot map showing the expressional patterns of the shared DEPs in S and T

