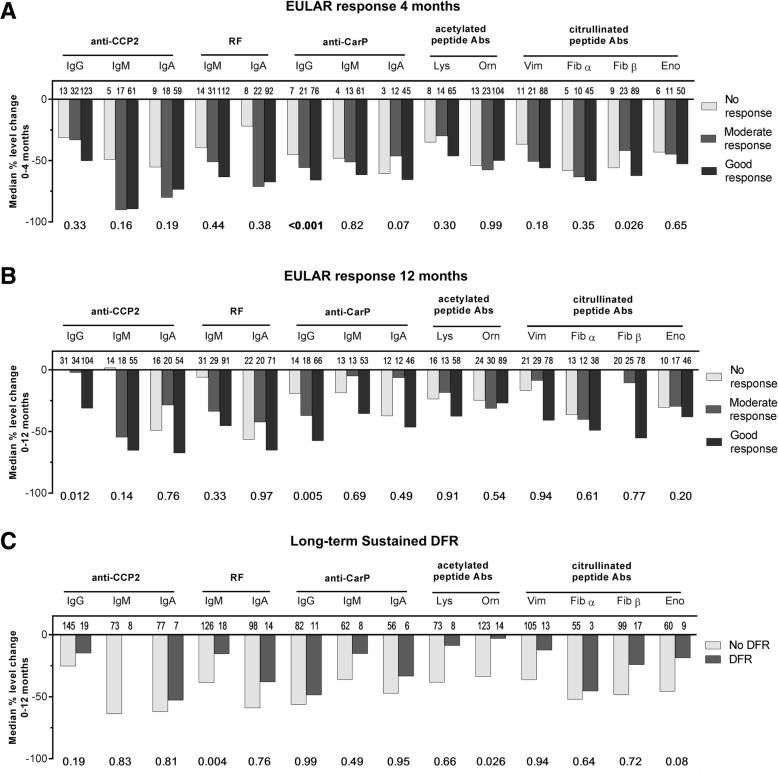
Fig. 3.
Changes in autoantibody levels do not associate with treatment outcomes.
Relative change (%) in autoantibody levels (raw data) preceding a EULAR response at 4 months, b EULAR response at 12 months, and c long-term sustained DFR. Bold typeface of p values below graphs, calculated by ordinal (a, b) and logistic (c) regression, indicates significance after Holmes-Bonferroni correction for multiple testing (14 tests). Besides age and gender, models in a are adjusted for baseline DAS and BMI, in b are additionally adjusted for randomization arm at 4 months and treatment decision at 8 months, and in c are adjusted for baseline DAS, disease duration, and treatment decisions as per b

