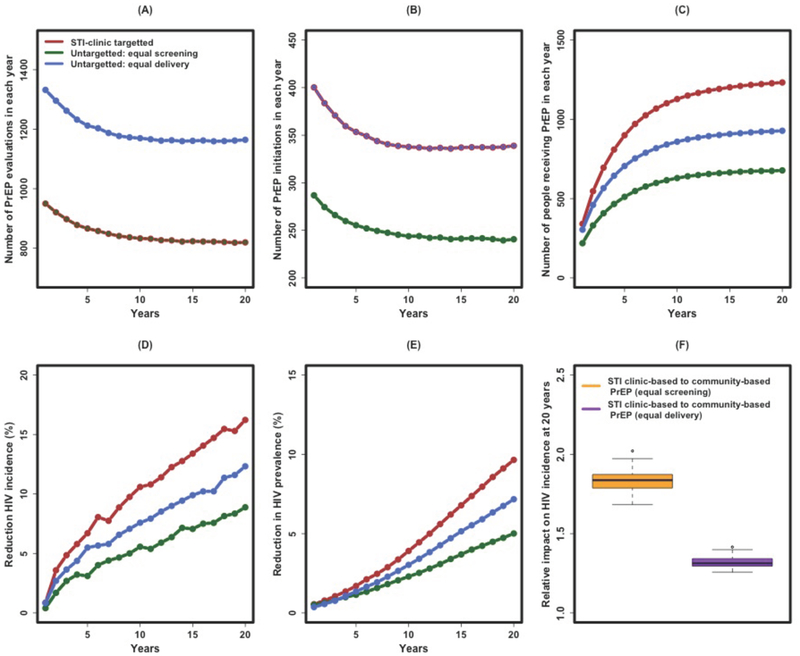
Figure 2: Impact of STI clinic-based versus community-based PrEP delivery.
Shown on the y-axes are the projected annual number of MSM screened for PrEP (A), initiating PrEP (B), and receiving PrEP (C) in a given year, as well as the projected reduction in HIV incidence (D), reduction in HIV prevalence (E), and the relative impact of STI clinic-based PrEP versus community-based PrEP on HIV incidence at 20 years (F). For Panels A through E, the quantities are shown in each year after enacting a PrEP campaign of sufficient size to evaluate all MSM estimated to present to the STI clinic every year (966 visits per year, red line), a comparable number of MSM randomly screened for PrEP every year (green line), or a comparable number of eligible MSM randomly starting PrEP (blue line) in any given week of the program. Thus, in Panel A, the red and green lines overlap (equal number of MSM screened for PrEP every year), and in Panel B, the red and blue lines overlap (equal number initiating PrEP every year). Panel F depicts the relative impact of STI clinic-based PrEP versus community-based PrEP, measured as the projected reduction in HIV incidence at the 20th year of implementation. These figures assume 60% PrEP uptake and 60% adherence to PrEP once initiated. STI, sexually transmitted infection; PrEP, pre-exposure prophylaxis for HIV.

