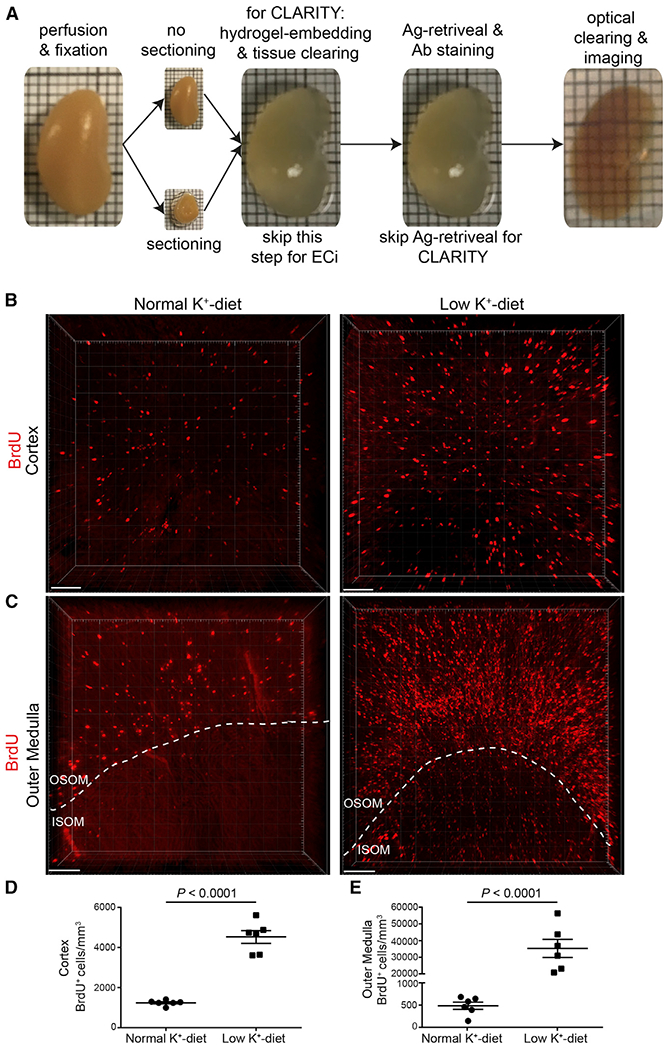
Figure 2. Optical Clearing and BrdU+ Cells in Ethyl-Cinnamate-Cleared Kidney Slices.

(A) PFA-fixed kidneys were either sliced in thick slices or not sectioned, and then two different protocols were applied. For CLARITY, tissue was immersed in hydrogel monomer solution, polymerization was induced, and then tissue was cleared. For ethyl cinnamate (ECi), antigen retrieval was performed. In both protocols, tissue was then stained with antibodies or dye and optical clearing was performed using CLARITY (easy clear index solution) or ethyl cinnamate. Confocal and light sheet microscopy were used for volume imaging. Note that different kidneys are shown here.
(B and C) Three-dimensional visualization of a representative z stack shows an increased number of BrdU+ cells in the cortex (B) and outer medulla (C) in mice on a low-potassium diet compared to mice on a normal-potassium diet. ISOM, inner stripe of the outer medulla; OSOM, outer stripe of the outer medulla.
(D and E) Quantification of (B) and (C). Two kidney slices per sample were used, and from each kidney slice, five z stacks were taken from both the cortex (D)and outer medulla (E) (covering ~50% of the outer stripe [OSOM] and 50% of the inner stripe [ISOM]). Imaging was performed with confocal microscopy using a 10× objective lens (Zeiss LSM 880 with Airyscan).
Data are represented as mean ± SEM (n = 6 mice). p values were calculated using the unpaired two-tailed Student’s t test. Scale bar, 100 μm. See also Video S1 (outer medulla under low potassium diet).
