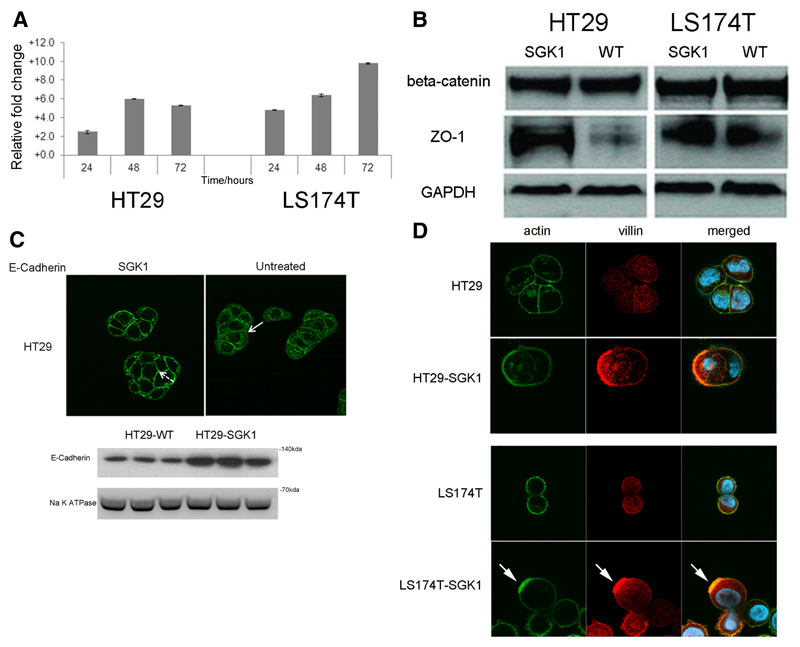
Figure 1. SGK1 causes colorectal cancer cell differentiation.
A. SGK1 transcription is increased upon sodium butyrate (NaBut) treatment in colorectal cancer cells. The column chart plots fold-change increases in SGK1 transcript levels, as measured by qRT-PCR, in HT29 and LS174T colorectal cancer cells upon treatment with NaBut, normalized to untreated control and relative to levels at time=0 hrs. Both cell lines showed a significant increase in SGK1 between 0 and 24 hours, and between 24 and 48 hours (t-test, p<0.01 in all cases, experiments in triplicate). SGK1 levels plateaued after 48 hours in HT29, whereas a further significant increase was found in LS174T.
B. Representative western blots of junctional proteins in HT29-SGK1 and LS174T-SGK1 cells and untreated wild-type controls. There are essentially unchanged levels of beta-catenin and an increase in ZO-1 abundance upon SGK1 re-expression. A similar ZO-1 increase was also found for cell line HCT116 (not shown).
C. Representative immunofluorescence images suggest re-localisation of E-cadherin from the cytoplasm in parenteral controls (solid arrows) to the membrane in SGK1 re-expressing HT29 (dashed arrows). The cellular fractionation blot confirms increased expression of E-cadherin in the membrane. Note that LS174T cells carry bi-allelic mutations of the CDH1 gene, resulting in protein absence.
D. Immunofluorescence analysis on HT29-SGK1 and LS174T-SGK1 and parental controls illustrates the formation of actin ‘caps’ (green, arrowed), co-localised with the apical marker villin (red), in SGK1-transduced cells only. This indicates the establishment of cell polarity owing to SGK1 re-expression.

