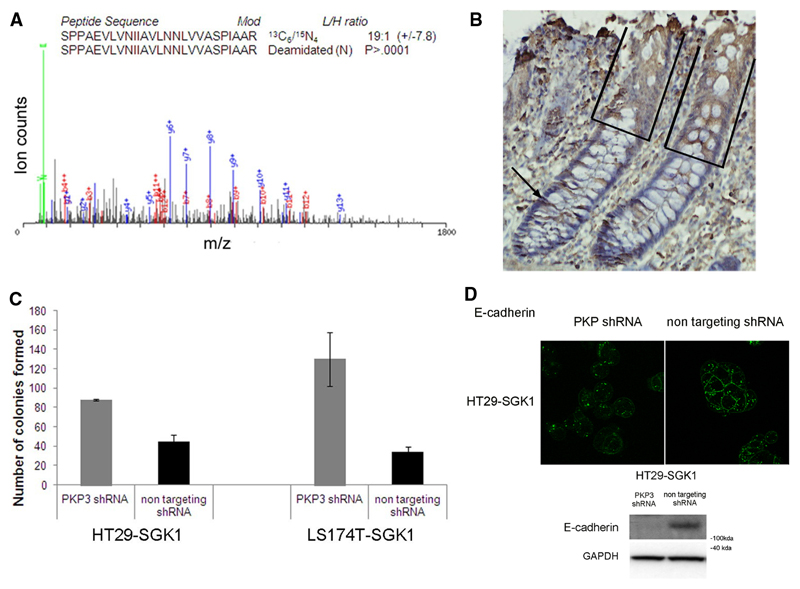
Figure 4. Plakophilin 3 is induced by SGK1 and in turn mediates features of differentiation.
A. Quantitative SILAC mass spectrometry reveals elevated PKP3 in SGK1 re-expressing cells. MS/MS spectrum shows PKP3-derived peptide 727-752, [M+3H]+ 884.2 (calculated MW 2649.5Da), where the fragment ions are indicated (green: immonium ions; blue: y-ions; red: b-ions). The light (SGK1 expressing cells) versus heavy (control cells) ratio as well as the significance (P) are indicated.
B. Immunohistochemistry on paraffin sections derived from normal human colonic tissue shows that expression of PKP3 is stronger in the differentiated compartment of the colonic crypt (boxed), where SGK1 is also expressed, that in the proliferative compartment (arrowed).
C. The bar chart represents the number of colonies formed in soft agar for HT29-SGK1 and LS174T-SGK1 cells with PKP3 knock-down (grey bars) or non-targeting shRNA (black bars), showing that SGK1-induced impaired anchorage-independent growth is reversed upon PKP3 knock-down (t-test p-values<0.005 in all cases).
D. Immunofluorescence shows that the SGK1-induced re-localisation of E-cadherin to the cell membrane is impaired upon PKP3 knockdown by shRNA compared with non-targeting shRNA controls. Representative western blots demonstrating decreased total E-Cadherin when SGK1 re-expressing cells are subjected to PKP3 knockdown by shRNA compared with non-targeting shRNA controls (results for LS174T cells not shown due to E-cadherin deficiency).

