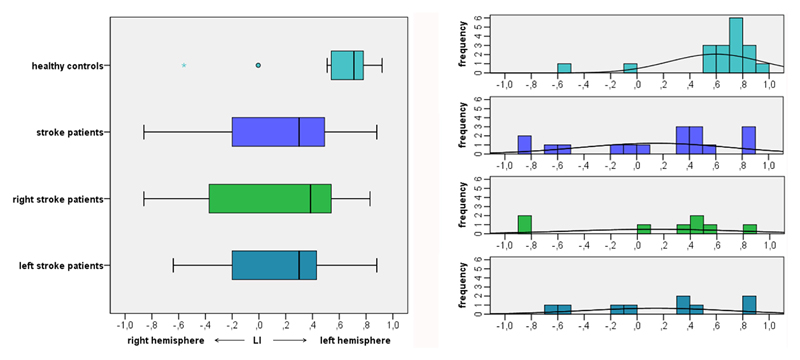
Figure 3.
LIs in study participants. LIs are depicted in individual study participants and in the groups of healthy controls, stroke patients overall, right stroke patients, and left stroke patients. ° indicates asymmetric outliers, * indicates extreme outliers (farther than 3 interquartile ranges).

