Figure 2.

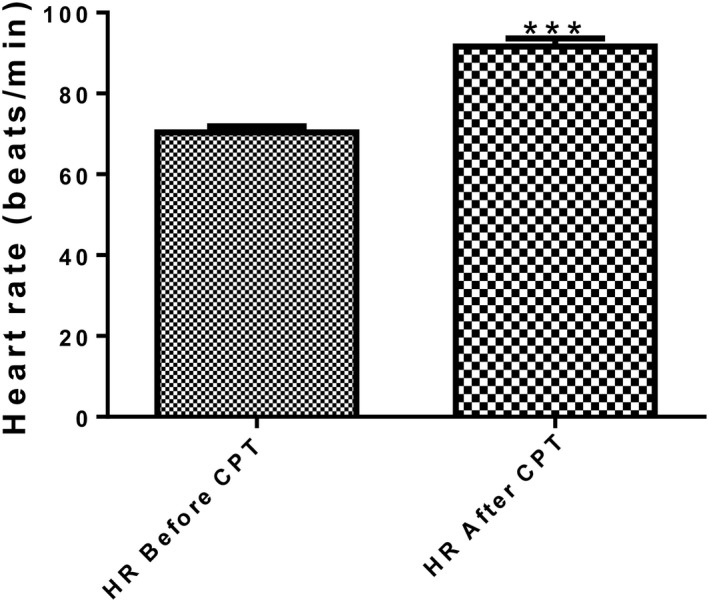
Heart rate of the participants before and after the cold pressor test (n = 56). *** = P < 0.0001 HR after CPT versus HR before CPT. HR, heart rate; CPT, cold pressor test.

Heart rate of the participants before and after the cold pressor test (n = 56). *** = P < 0.0001 HR after CPT versus HR before CPT. HR, heart rate; CPT, cold pressor test.