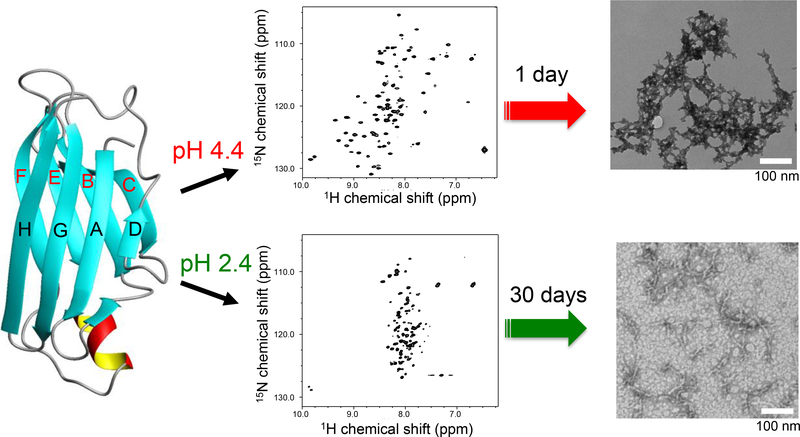
Figure 1.
A schematic diagram for the two distinct misfolding and amyloid formation pathways of TTR at the two different acidic conditions (pH 2.4 and 4.4) along with 2D 1H/15N HSQC NMR spectra and TEM images. A very low protein concentration of 0.15 mg/ml was used for the 2D 1H/15N HSQC NMR experiments to ensure TTR exist as monomeric forms. The TEM images were obtained from the TTR samples (0.2 mg/ml and 10 mg/ml) incubated for 1 day and one month at pH 4.4 and 2.4, respectively. The different protein concentrations and incubation times were used because of the different aggregation kinetics. At pH 2.4, a much higher protein concentration was required to obtain amyloid precipitates due to the much slower aggregation kinetics than those at pH 4.4.

