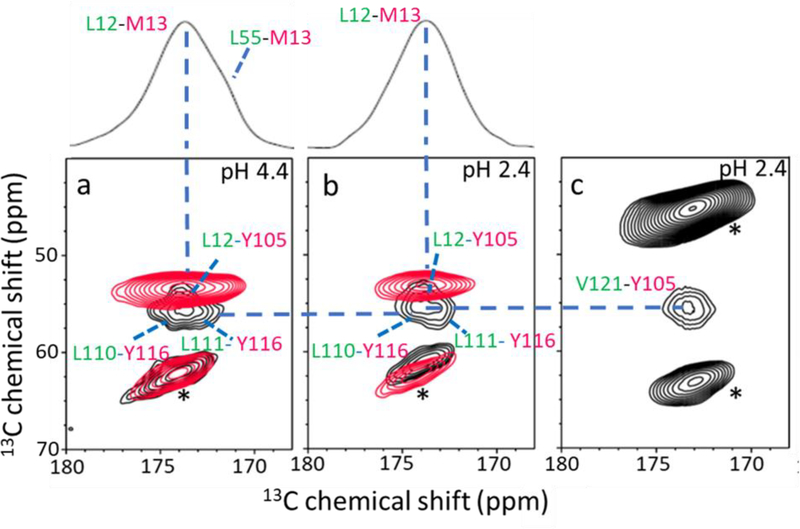
Figure 3.
(a) Overlaid 2D PDSD spectra of the amyloid-4 with 13CO-Leu/13Cα-Met (red; labeled on DA), and 13CO-Leu/13Cα-Tyr (black; labeled on AGH) TTR. (b) Overlaid 2D PDSD spectra of the amyloid-2 with the same labeling schemes in a. (c) 2D PDSD spectrum of the amyloid-2 with 13CO-Val/13Cα-Tyr labeled on GH strands. The 1D slice in Figure 3a and 3b was drawn for the L/M spin pairs. The NMR spectra were obtained with a mixing time of 500 ms at a 1H frequency of 830 MHz. The L/Y and L/M spin pairs in the amyloid-4 state were unambiguously assigned in our previous solid-state NMR studies. [17] In order to confirm that the cross-peaks originate from the spin pairs within the TTR monomer, the 2D PDSD experiments were conducted on the mixture of singly 13CO- and 13Cα- labeled TTRs (1:1 ratio, for example a mixture of 13CO-Leu-TTR and 13Cα-Tyr-TTR) and no cross-peak was observed from the mixture. * denotes spinning sidebands.

