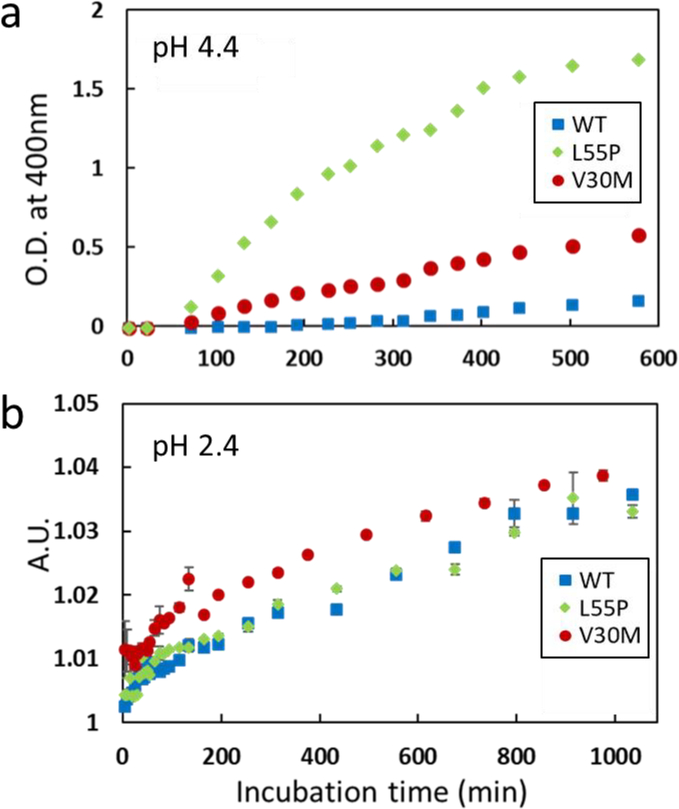
Figure 5.
Aggregation kinetics of the WT and mutant forms of TTR measured at pH 4.4 (a) and 2.4 (b). Optical density at 400 nm was monitored at pH 4.4, and dynamic light scattering was used to probe aggregation at pH 2.4. The scattering intensity at 100 μs in the scattering profile shown in Figure S8 was plotted and compared for the WT and mutant forms of TTR. Errors in the experimental measurements were mostly smaller than the size of the markers.

