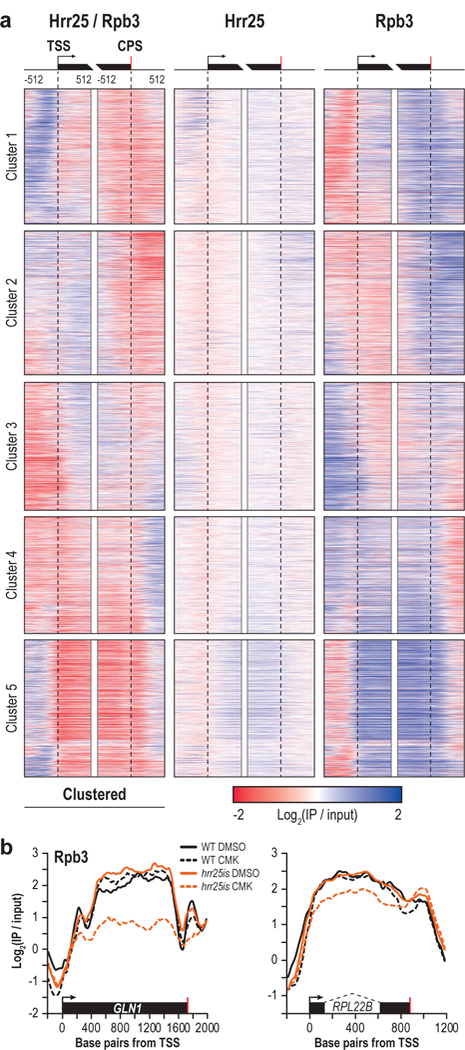
Figure 5 |. Hrr25 profiles correlate with Pol II at protein coding genes.

(a) Heatmap of Hrr25 ChIP normalized to Rpb3 flanking the TSS (arrow) and CPS (red bar) of protein coding genes (left). Genes were sorted into five clusters via k-means clustering. Heatmap of Hrr25 (middle) or Rpb3 (right) at the same genes are shown. (b) Representative Rpb3 ChIP traces in WT (black) or hrr25is (orange) cells treated with either DMSO (solid lines) or CMK (dotted lines) at GLN1 (left) and RPL22B (right). Dotted lines indicate an intron.
