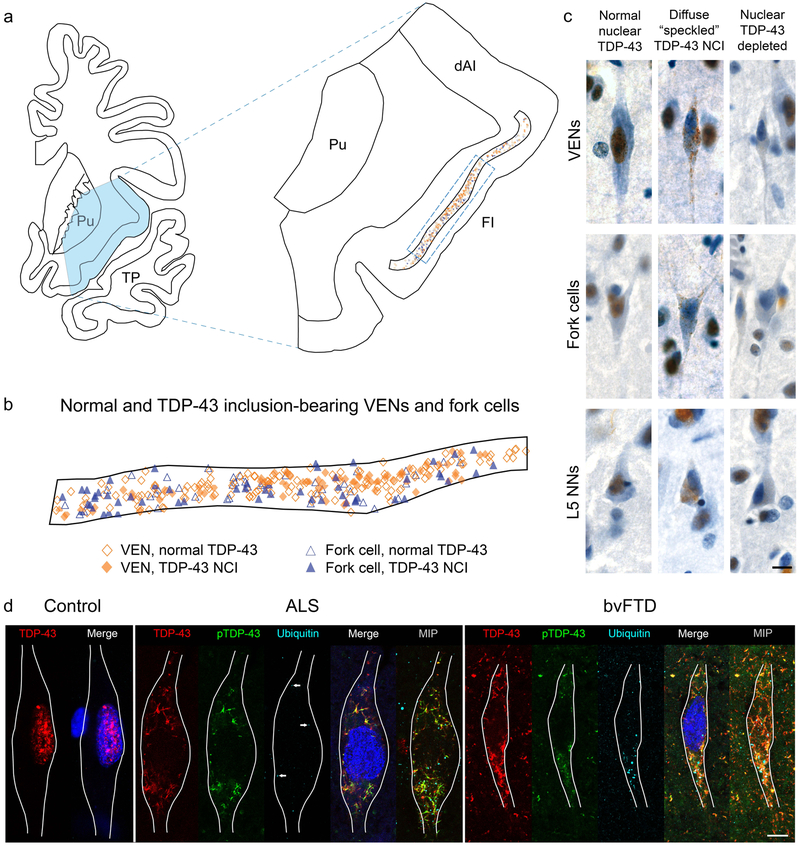
Fig. 1. Distribution of normal and inclusion bearing neurons and patterns of TDP-43 aggregation in VENs, fork cells, and neighboring Layer 5 neurons.
(a, b) Mapping of all VENs and fork cells located in a section of the FI (outlined in a) in subject S5 shows similar distribution of normal and inclusion-bearing VENs and fork cells across Layer 5 (b). B shows an expanded region of the FI indicated by the dashed rectangle in a. (c) Punctate TDP-43 neuronal cytoplasmic inclusions (NCIs) were the most common inclusion type in VENs, fork cells, and neighboring Layer 5 neurons (L5 NNs). Neurons without TDP-43 NCIs but lacking normal nuclear TDP-43 (“nuclear TDP-43-depleted”) were observed for all cell types in the majority of patients. All images in (c) are from subject S5. (d) Images of VENs from a single confocal z slice with TDP-43 (red), phospho-TDP-43 (pTDP-43, green) and ubiquitin (cyan) immunostaining, and Nissl-stained nuclei (blue). MAP2 immunostaining (not shown) was used to trace VEN outlines. Normal VENs in control subjects (a VEN from subject N4 is shown) and patients with bvFTD/MND showed robust nuclear TDP-43 staining and no TDP-43 aggregation, phosphorylated TDP-43, or ubiquitin staining. In subjects with ALS (subject S4 is shown), TDP-43 inclusions were phosphorylated, with punctate, scattered ubiquitin staining dispersed around the TDP-43 inclusions. A few characteristic ubiquitin puncta are indicated by arrows on the single z slice from the patient with ALS, and are more clearly seen on a maximum intensity projection of 15 z slices through the VEN soma. In severely affected subjects (subject S15 is shown), TDP-43 inclusions were phosphorylated and foci of ubiquitination were larger and more numerous. The merge of red (TDP-43) and green (phospho-TDP-43) is shown as yellow. Brightness and contrast for each color channel in D were adjusted separately. Scale bars in (c) and (d) represent 10 μm. dAI: dorsal anterior insula; FI: frontoinsular cortex; MIP: maximum intensity projection; Pu: putamen; TP: temporal pole.

