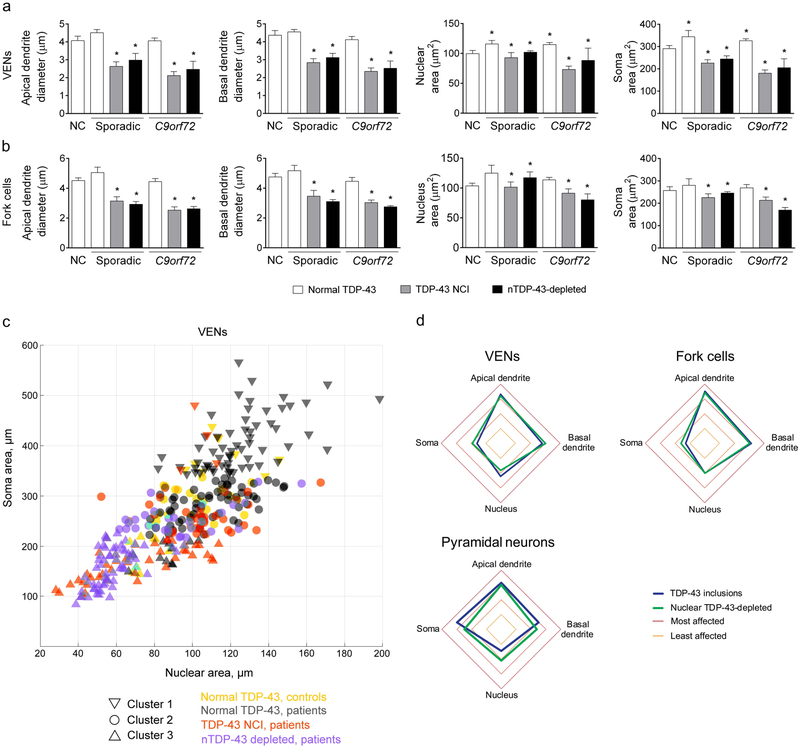
Fig. 4. TDP-43 aggregation and TDP-43 depletion are linked to VEN and fork cell atrophy in both sporadic and C9orf72-bvFTD/MND.
(a, b) Morphometric analyses revealed that VEN (a) and fork cell (b) somatic and nuclear area, and apical and basal dendritic diameter were significantly smaller (20-39%) in cells with TDP-43 neuronal cytoplasmic inclusions (NCIs) than those without in bvFTD/MND patients. Somatodendritic atrophy was also evident in nuclear TDP-43-depleted neurons without NCIs (nTDP-43-depleted). Intriguingly, VENs (a) with normal nuclear TDP-43 in bvFTD patients showed higher nuclear (16%) and somatic area (18%) compared to VENs in controls. Normal VENs and fork cells neurons in bvFTD had a significantly larger nucleus and soma than TDP-43 inclusion-bearing and nuclear TDP-43-depleted neurons. Data in a and b are shown as mean ± SEM, with the mean and range shown for nuclear TDP-43-depleted neurons in sporadic cases (nuclear TDP-43-depleted VENs and fork cells were identified in two of the sporadic cases that underwent morphometric analysis). * p < 0.05 compared with normal controls. (c) Clustering analysis of VEN nucleus and soma area, and apical and basal dendritic diameter identified three clusters, primarily corresponding to normal cells from patients (cluster 1) and inclusion bearing/nuclear TDP-43-depleted VENs (cluster 3), with normal cells from control subjects and some TDP-43 inclusion/depleted neurons combined in cluster 2. Only two (nuclear and soma area) of the four parameters used to define clusters are shown for clarity. (d) Apical dendrites, followed by basal dendrites, were the most affected compartments in TDP-43 inclusion-bearing and nuclear TDP-43 depleted VENs and fork cells, with the highest mean rank, corresponding to highest z score.

