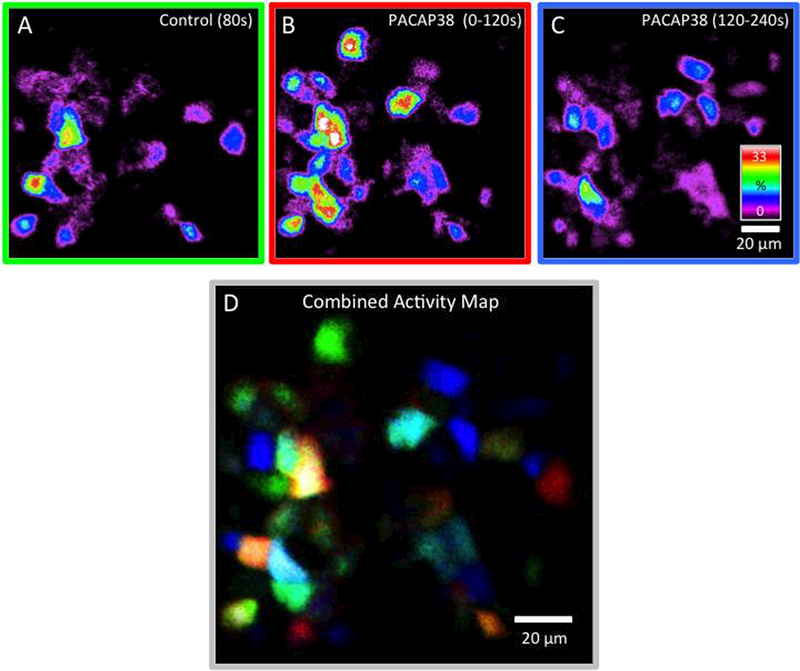
Figure 3: Integrated Ca2+ activity in urothelial cells before and after the addition of PACAP38 (100 nM) during a continuous recording.

A) Integrated Ca2+ activity in urothelial cells during the first 80s under control conditions (no drugs) reveals Ca2+ activity in approximately half of the urothelial cells. B) After the addition of PACAP38 (100 nM), a substantial number of previously quiescent cells became active (0–120s). C) The response to PACAP38 waned over time (120–240s). D) To visualize the populations of cells that were active during control conditions and after the addition of PACAP38, each of the top 3 panels was converted to grayscale and assigned a color channel (A = red, B = green & C = blue) and combined to create an RGB image. Calibration bar in C and D represents 20 μm. Integrated Ca2+ activity is presented on a spectrum scale with white representing Ca2+ transients in cells that were active for the equivalent of 1/3rd of duration of the movie segment. Chi-square analyses demonstrated a statistical difference (p ≤ 0.001) in the incidence of quiescent cells increasing activity after PACAP38 addition and of cells that ceased activity after PACAP38 addition in urothelial preparations.
