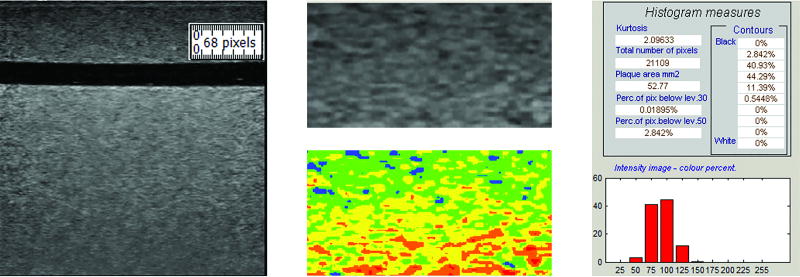
Figure 3.
The region of interest (ROI) traced for grayscale analysis is identified by the ruler tool (left). The resulting segmentation is shown in grayscale and in color (middle). Colors correspond to the following grayscale values: black – 0 to 25; blue – 26 to 50; green – 51 to 75; yellow – 76 to 100; orange – 101 to 125; and, red – 126 to 255. Grayscale median value and grayscale value histogram for this segmentation is also shown (right). The GSM for this ROI is 78.90.

