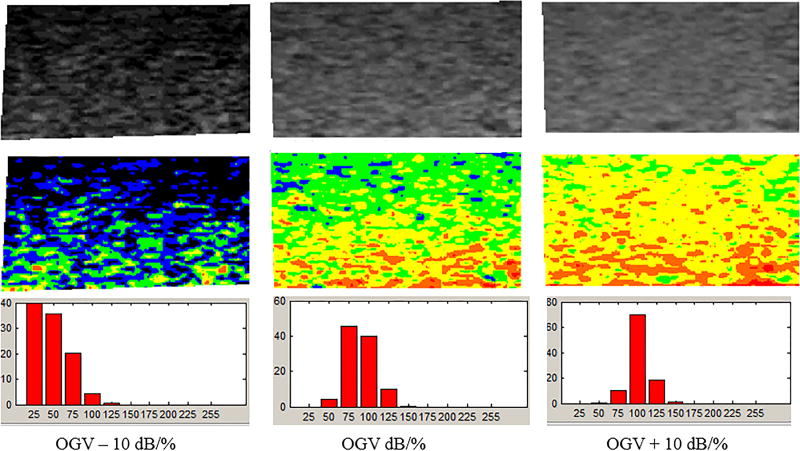
Figure 4.
The output from the grayscale analysis software shows segmented grayscale images in the top row and colorized images better depicting grayscale variations in the bottom row. With this software, the colors correspond to the following grayscale values: black – 0 to 25; blue – 26 to 50; green – 51 to 75; yellow – 76 to 100; orange – 101 to 125; and, red – 126 to 255...GSM for OGV – 10 dB/%, OGV dB/%, and OGV + 10 dB/% are 35.45, 75.53, and 90.97.

