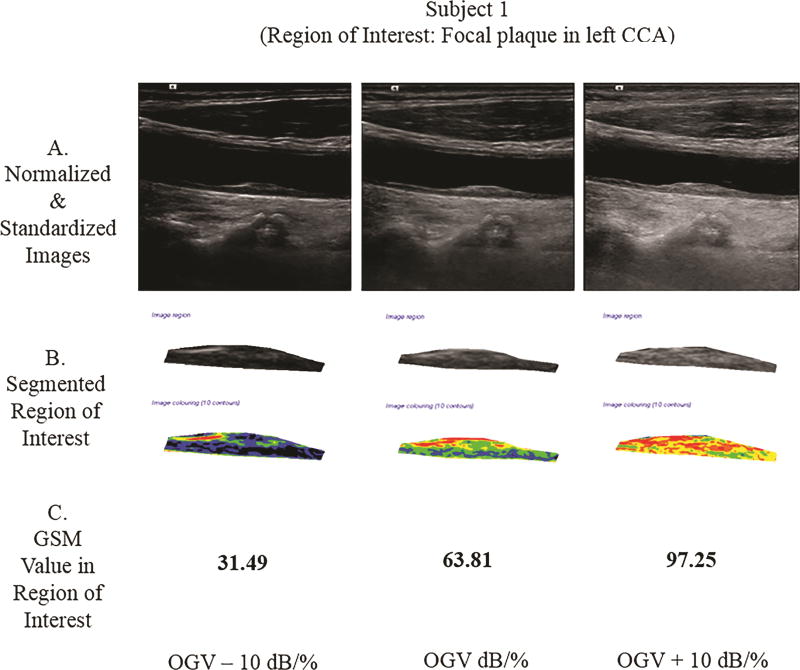
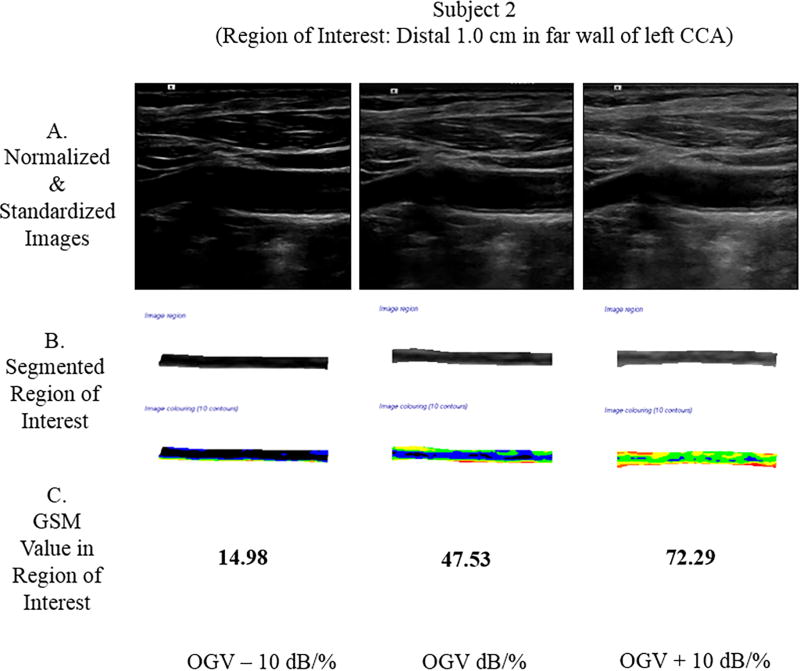
Figure 7.
Grayscale analysis results for the 2 human participants obtained across 3 different gain values are shown below. For each participant, row A shows the normalized and standardized images used. Images in row B show the segmented ROIs in grayscale and as a colorized output from the plaque analysis software. Row C provides the GSM values for these ROIs. Note that as the gain value increases, the GSM value likewise increases, which agrees with the grayscale phantom results for a single ultrasound imaging system. CCA indicates common carotid artery.


