Fig. 4.

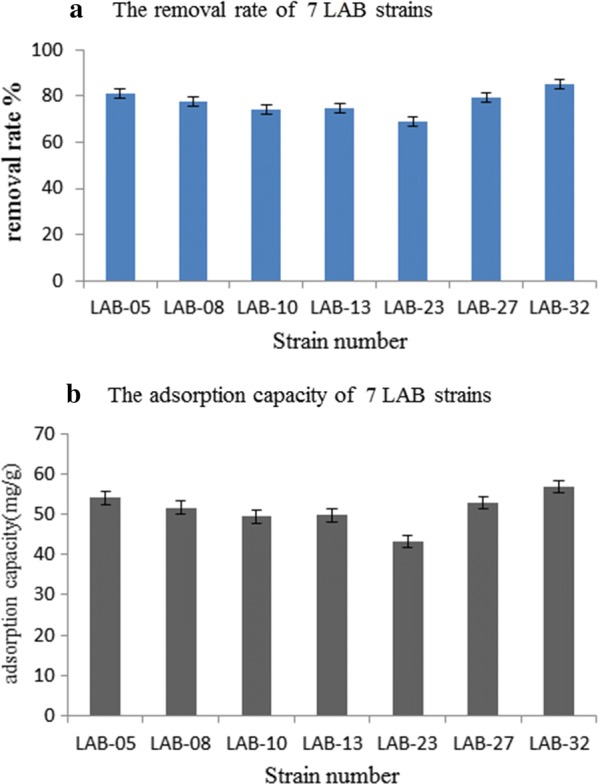
The removal rate (a) and adsorption capacity (b) of 7 LAB strains. The blue bar chart represents the removal rate and the gray bar chart represents the adsorption amount

The removal rate (a) and adsorption capacity (b) of 7 LAB strains. The blue bar chart represents the removal rate and the gray bar chart represents the adsorption amount