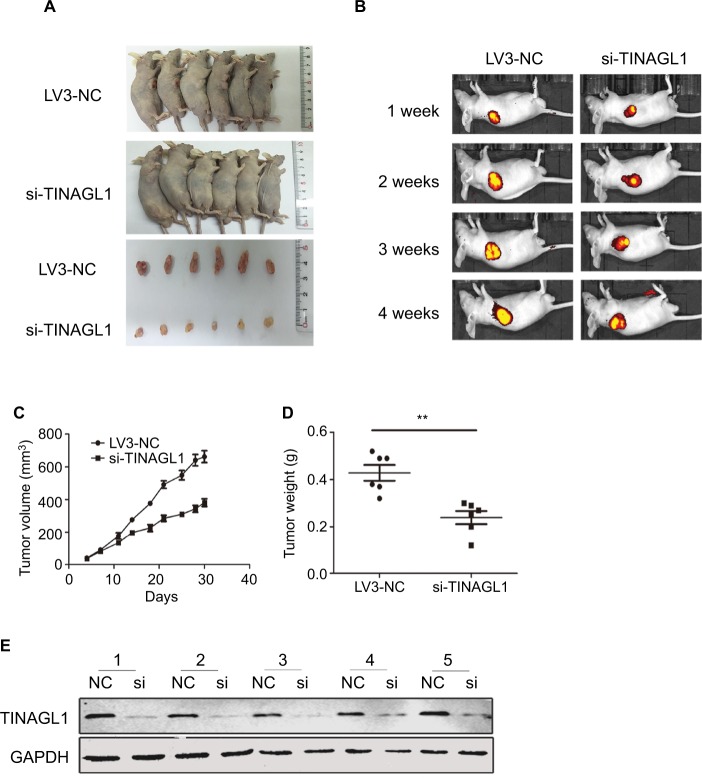
Figure 4.
Effect of TINAGL1 on the growth of tumor in nude mice.
Notes: (A) Tumor masses in the different mouse groups. (B) In vivo fluorescence imaging of tumors 1, 2, 3, and 4 weeks after inoculation. (C and D) Tumor volume and weight in different mouse groups. (E) Western blots showing TINAGL1 expression in the tumor tissues of different groups. **P<0.01.

