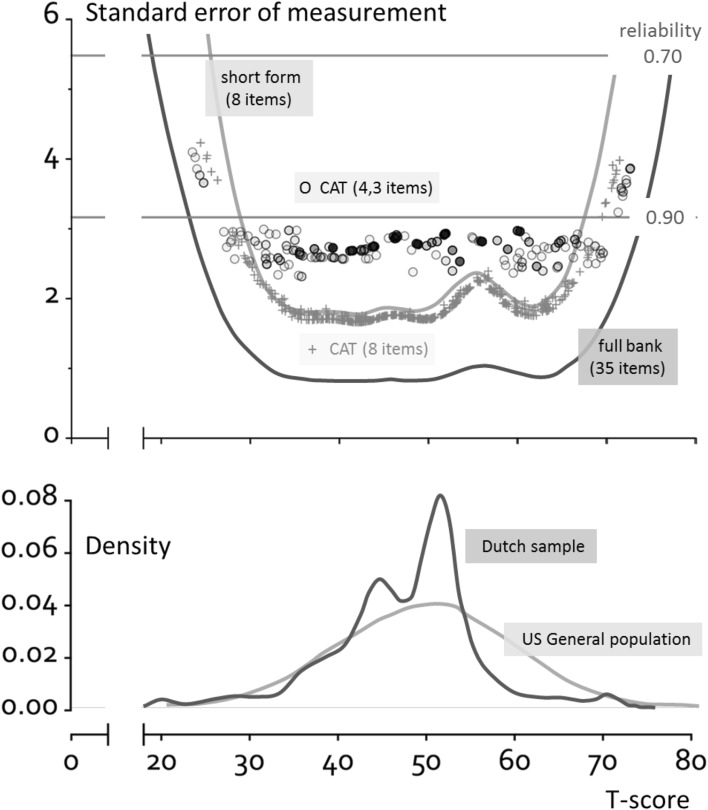
Fig. 2.
Reliability of the PROMIS V2.0 item bank Satisfaction with Participation in Social Roles and Activities when using different applications (full item bank, short form and CATs (the open circle symbols represent the standard CAT (shading represents many of the same scores) and the plus symbols represent the fixed 8-item CAT)) and distribution of T-scores (based on full item bank) in the population. For n = 28 theta could not be estimated and CAT theta scores were set to − 4 (T-score 10, n = 12) or 4 (T-score 90, n = 16) in both simulated CATs (these persons are not shown in the plot)

