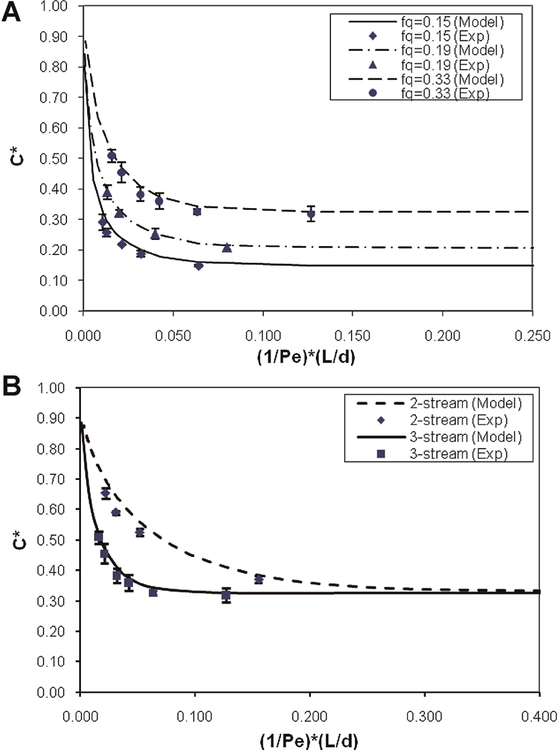
Figure 3.
A: Plot of C* versus (1/Pe) × (L/d) showing DMSO removal of the device without cells present. Three different flow rate fractions (fq) are shown. Curves are also plotted showing the numerical model predictions for DMSO extraction. Each point represents the average of at least three separate experiments, and error bars denote one standard deviation. B: Plot of C* versus (1/Pe) × (L/d) comparing DMSO removal in the three-stream, vertical device to the two-stream, horizontal device for fq = 0.33. Again lines represent model predictions and each point shows the average of at least three separate experiments. [Color figure can be seen in the online version of this article, available at http://wileyonlinelibrary.com/bit]

