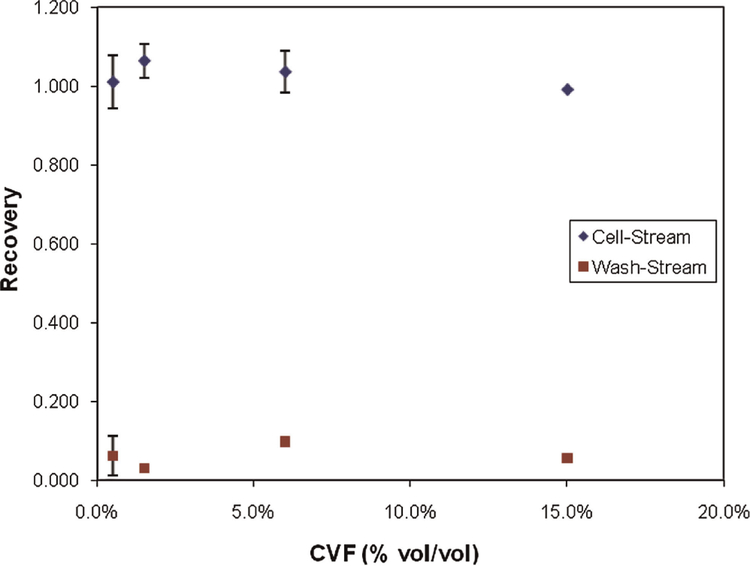
Figure 6.
Cell recovery from the cell stream outlet and wash stream outlets versus CVF. Experiments were performed using Qc = 2.5 mL/min and fq = 0.33. For CVF = 0.5%, 1.5%, and 6%, experiments were performed in triplicate, with error bars showing one standard deviation. Results for CVF = 15% represent a single experiment. [Color figure can be seen in the online version of this article, available at http://wileyonlinelibrary.com/bit]

