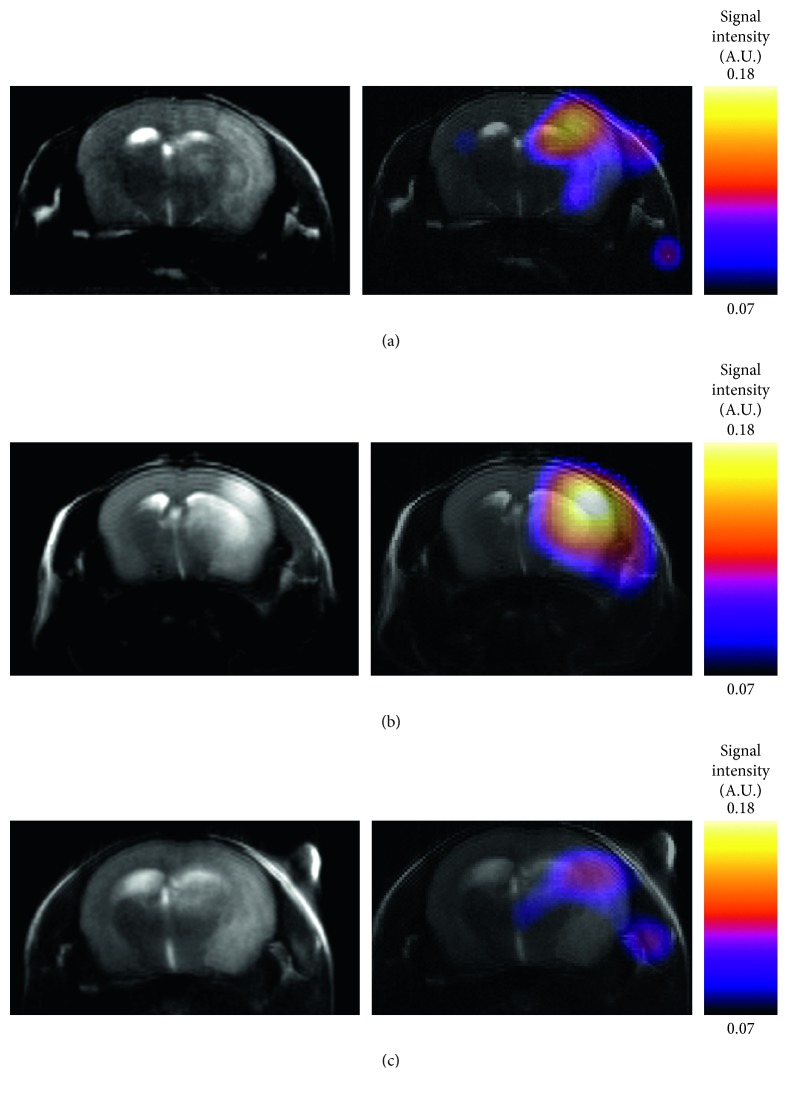
Figure 4.
Representative MR images of the mice ischemia model. T2-weighted images (the left column) and 19F-MRSI coregistered and superimposed with T2-weighted images (the right column) of ischemia with intravenous administration of the saline (WT-saline) group (a), ischemia with intravenous administration of t-PA (t-PA) group (b), and MMP2 knockout (MMP2 KO) group (c).

