
Figure 1.
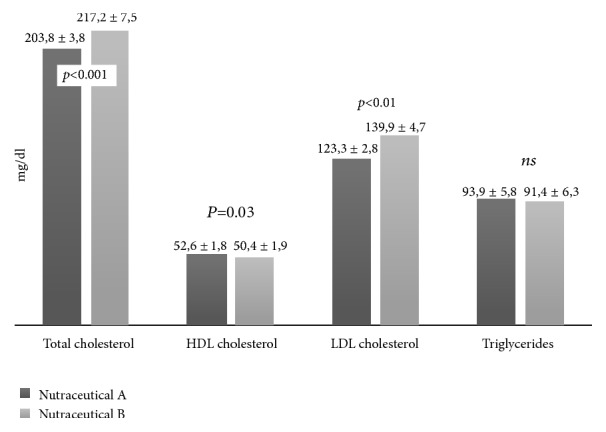
Lipid profile at the end of the study period (ANCOVA analysis adjusted for age, gender, and the baseline values); data are presented as mean ± standard errors values.
Official websites use .gov
A
.gov website belongs to an official
government organization in the United States.
Secure .gov websites use HTTPS
A lock (
) or https:// means you've safely
connected to the .gov website. Share sensitive
information only on official, secure websites.
Lipid profile at the end of the study period (ANCOVA analysis adjusted for age, gender, and the baseline values); data are presented as mean ± standard errors values.