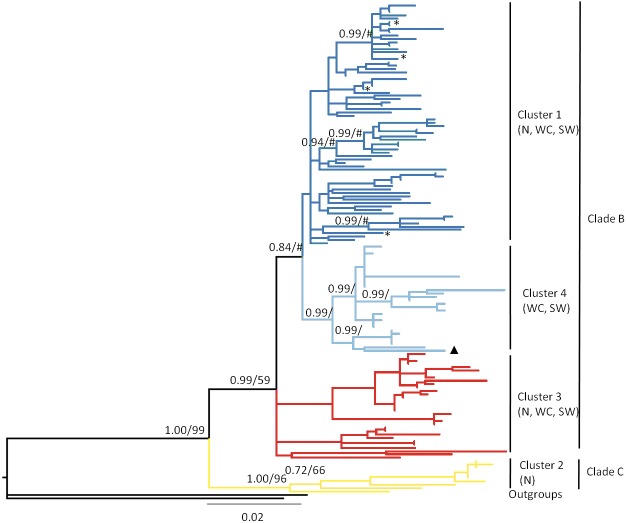
Figure 2. Bayesian phylogram based on the combined analysis of mtDNA control region and cytochrome b data drawn from 146 Macronycteris commersoni individuals.
Nodal support values are represented as Bayesian posterior probability/maximum likelihood bootstrap support. Only values greater than 50 are shown. The tree is color coded based on the result of the genetic mixture analysis in BAPS (Fig. 4). ∗, specimens from eastern Madagascar, specifically the sites of Analalava and Tampolo; ▴, specimen from Andringitra; N, north; WC, west central; SW = southwest.

