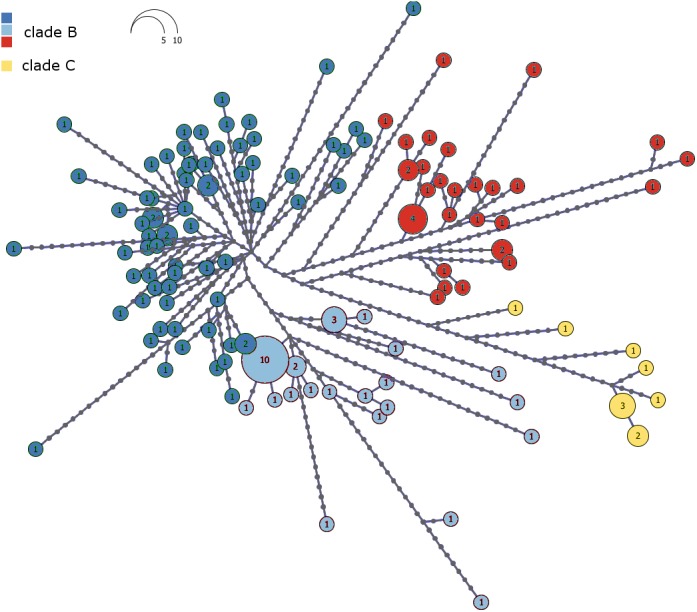
Figure 3. Haplotype network of the combined mtDNA control region and cytochrome b data drawn from 146 individual Macronycteris commersoni.

Haploviewer was used to estimate the most parsimonious network. Clades are color coded based on the BAPS clustering results (as in Fig. 2). Numbers inside the proportionally sized circles represent the number of individuals sharing that particular haplotype.
