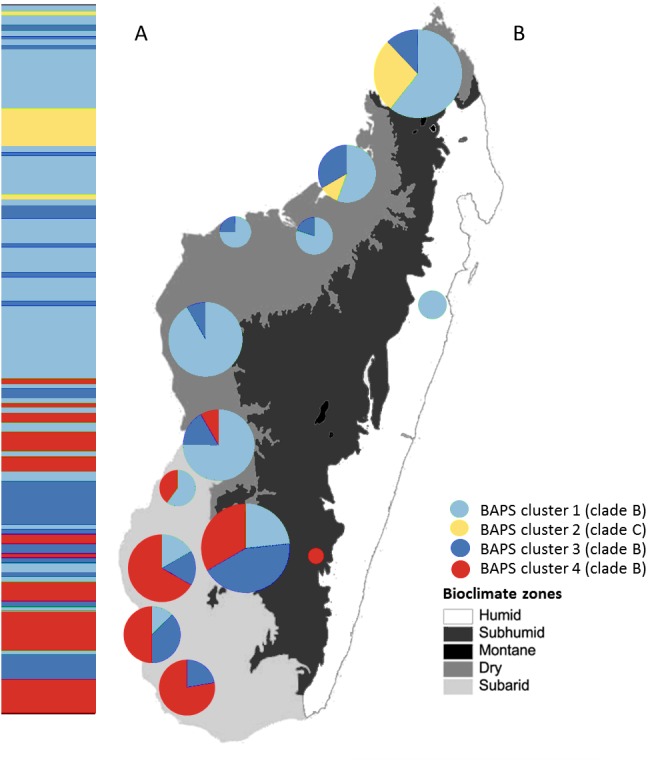
Figure 4. Posterior mode clustering of Macronycteris commersoni using the concatenated mtDNA data in an individual-based genetic mixture analysis in BAPS.

(A) Bar graphs for genetic structure with K = 4. Each bar represents an individual organized by latitude. Every different colour represent a cluster. (B) Distribution of estimated BAPS cluster frequencies. The 146 specimens are grouped by latitude and by locality and some neighbouring localities have been grouped together.
