Figure 5.

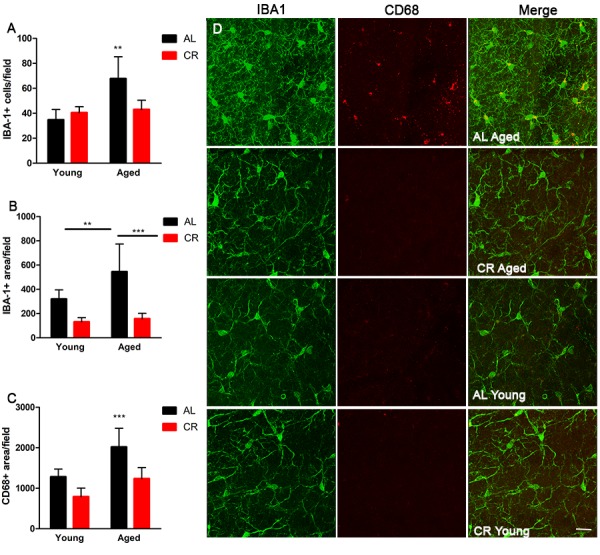
Microglia activation is mitigated by calorie restriction. (A) Quantification of the number of cells expressing the microglia marker Iba1 in the young and aged CR and AL mice. (B) Quantification of Iba1 reactivity in the different groups of mice. (C) Quantification of the activated microglia marker CD68 in the SVZ of the groups of mice. (D) Representative confocal images of Iba1 and CD68 microglia expression in the different groups of mice. Scale bar =25 µM. ***=p<0.001, **=p<0.01, two-way ANOVA, data are presented as mean ± SEM, n=5/group.
