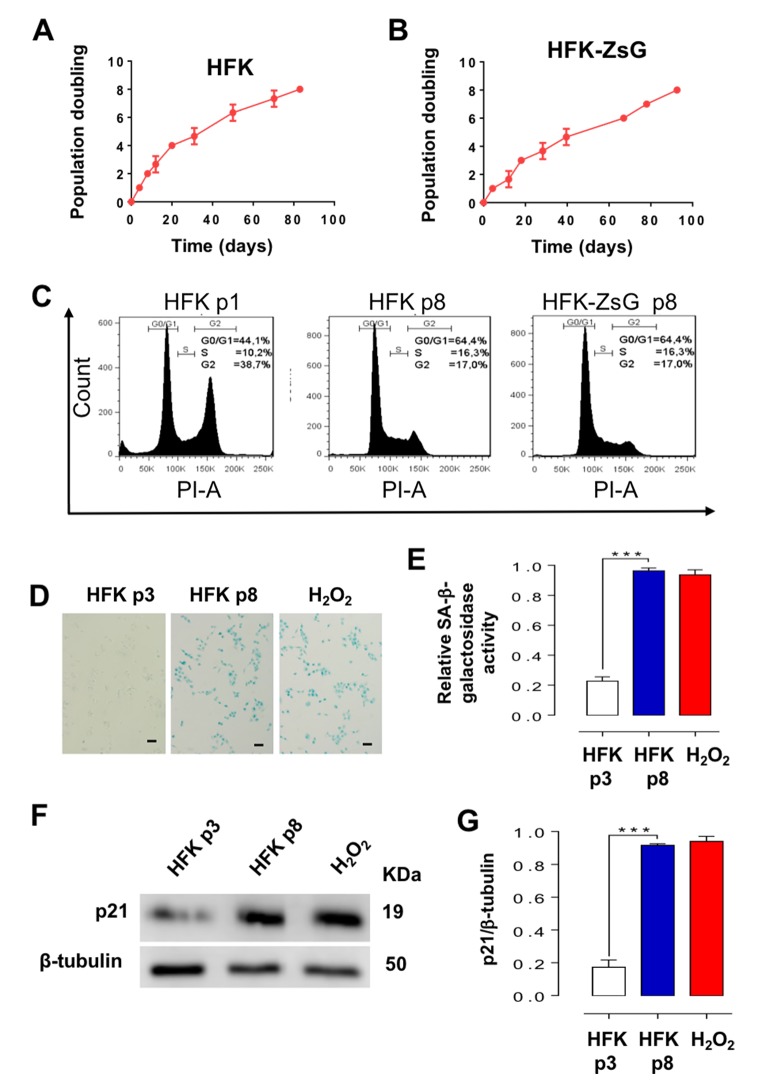
Figure 3.
HFK and HFK-ZsG undergo senescent arrest in G1 at p8. (A, B) A triplicate analysis of proliferation rate of HFK and HFK-ZsG was plotted as time (days) versus cell doubling or passage number. Neither cell population proliferated past p8. (C) Flow cytometry of HFK at p1 and p8 and HFK-ZsG at p8 shows that non-E2-expressing cells arrest in G1 at p8. (D) HFK at p8 were positive for SA-β-galactosidase staining, which was negative in p3 cells. H2O2 was used as positive senescence control (Bars = 100 μm). (E) A triplicate analysis of the results shown in D revealed a 4 to 5-fold increase in SA-β-galactosidase activity, compared to p3 cells, and similar to the level of HFK treated with H2O2 (***p<0.005). (F) In HFK at p8, p21 was upregulated compared to p3 cells. (G) A triplicate analysis of the experiment in F revealed a 4 to 5-fold increase in p21 levels compared to p3 cells, and at a similar level to H2O2-treated cells (***p<0.005).

