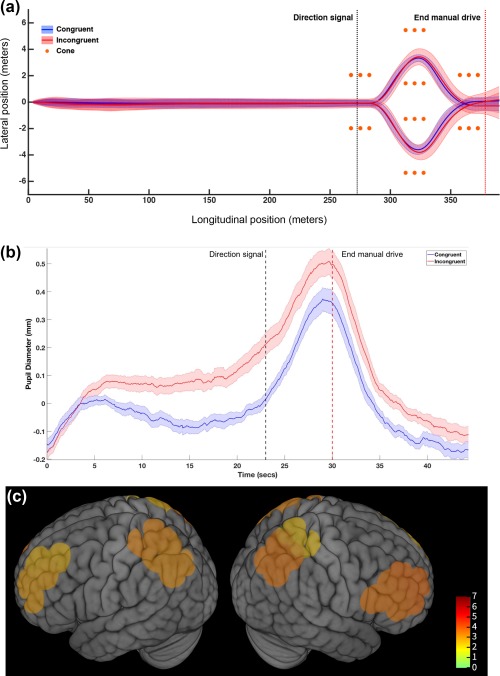
Figure 3.

(a) Driving performance summarized by mean vehicle position across all trials and all participants. Straight portion begins at the start of the trial and ends with presentation of the direction signal. Turn potion of the trial starts at the direction signal and ends at the end of the manual drive. Left and right turns are shown separately. Bold lines represent means and shaded regions indicate standard error. (b) Pupil response across the trial measured by SMI eye tracking goggles indicate a significant main effect of driving. Bold lines represent means and shaded regions indicate standard error. (c) Cortical activation for incongruent versus congruent conditions during the double lane change maneuver. Colored regions indicate areas demonstrating significant activation differences between incongruent and congruent conditions using oxygenated hemoglobin (Oxy Hb, p(FDR) < .05) as the primary measure of cortical activity. Channel locations projected onto cortical surface with T values indicated in color bar. Channel locations are enlarged (diameter = 3 cm) to estimate spatial extent of measured underlying cortical region [Color figure can be viewed at http://wileyonlinelibrary.com]
