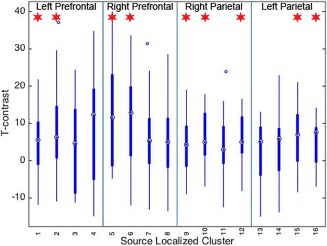
Figure 4.

T contrast values for each region for incongruent versus congruent conditions during the double lane change maneuver. T values indicating activation differences between incongruent and congruent conditions based on oxygenated hemoglobin (Oxy Hb). Source clusters are listed along the x‐axis. * indicates p(FDR) < .05 [Color figure can be viewed at http://wileyonlinelibrary.com]
