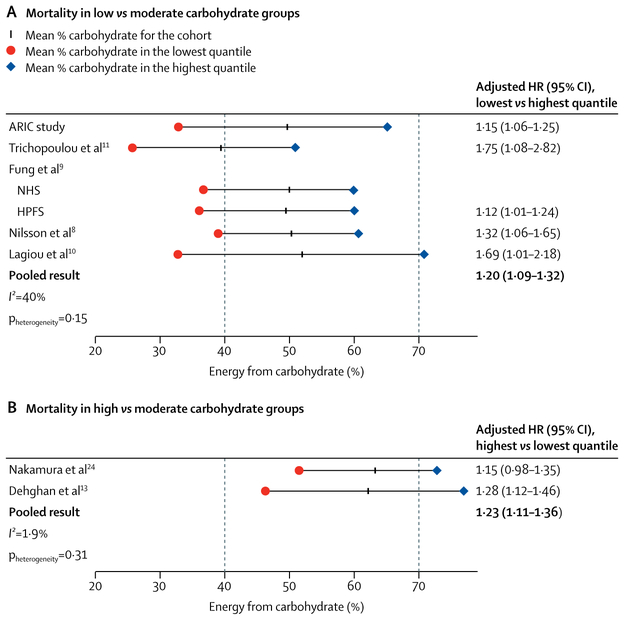
Figure 2: Carbohydrate intake and mortality risk across multiple cohort studies.
Mean values of percentage of energy from carbohydrate (% carbohydrate) reported in previously studied cohorts from lowest to highest quantiles. Adjusted HRs are from analyses of low carbohydrate scores versus high carbohydrate scores (n=432179, all-cause deaths=40 181). Dotted lines indicate cutoffs for low carbohydrate (<40%) and high carbohydrate (>70%). (A) Low carbohydrate versus moderate carbohydrate (40–70%) reference group. (B) High carbohydrate versus moderate carbohydrate reference group. HR=hazard ratio. ARIC=Atherosclerosis Risk in Communities. NHS=Nurses Health Study. HPFS=Health Professionals Follow-up Study.

