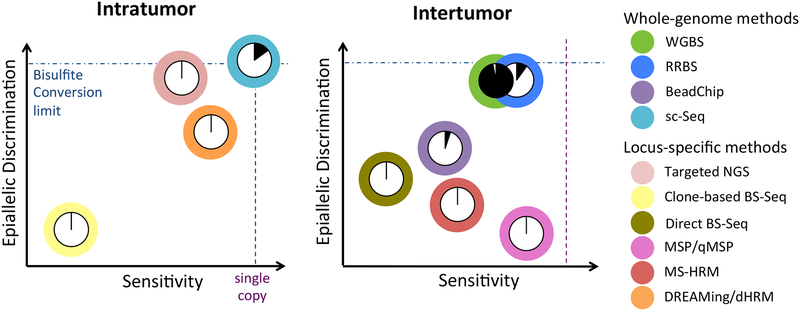
Figure 3. Comparison of DNA methylation detection techniques.
Methylation detection methods are shown categorized according to whether they are best suited to the assessment of intratumor heterogeneity (left) or intertumor heterogeneity (right). Each technique is represented by a color-coded circle with a pie chart indicating its relative methylome coverage and plotted according to its relative ability to resolve different methylation patterns (epiallelic discrimination) versus its relative ability to detect those patterns within a mixed population (sensitivity).

