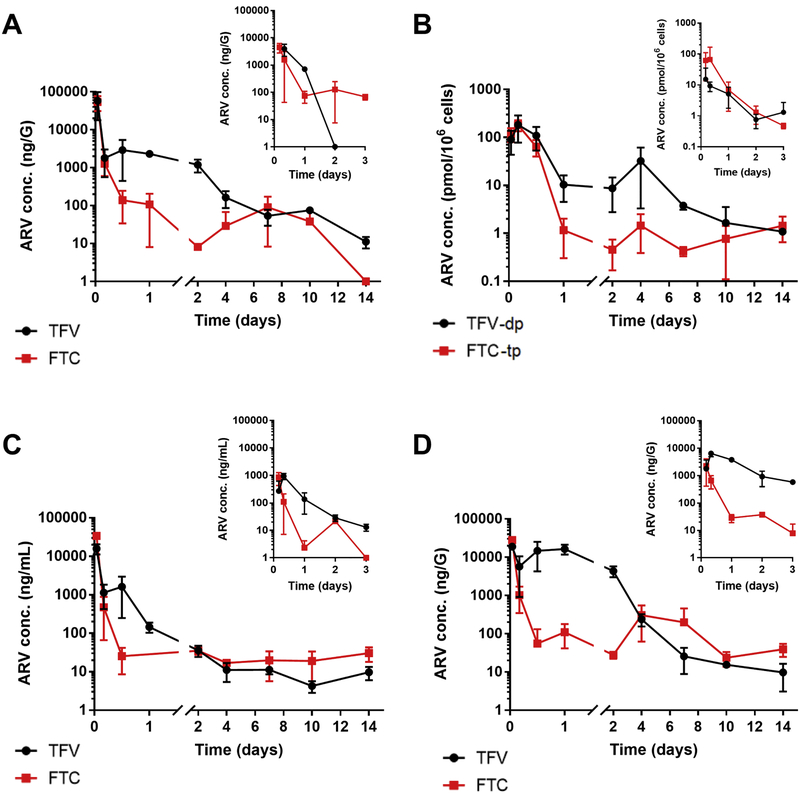
Figure 1.
The TFV (black) and FTC (red) concentration-time curves in vagina (A), respective active metabolites i.e. TFV-dp (black) and FTC-tp (red) in PBMCs (B), plasma (C), colon (D), obtained from hu-NSG mice receiving each drug at 200 mg/kg as TAF+FTC NP and the respective insert graphs presents the same studies on mice that received each drug at 200 mg/kg as TAF+FTC solution.

