
Figure 5.
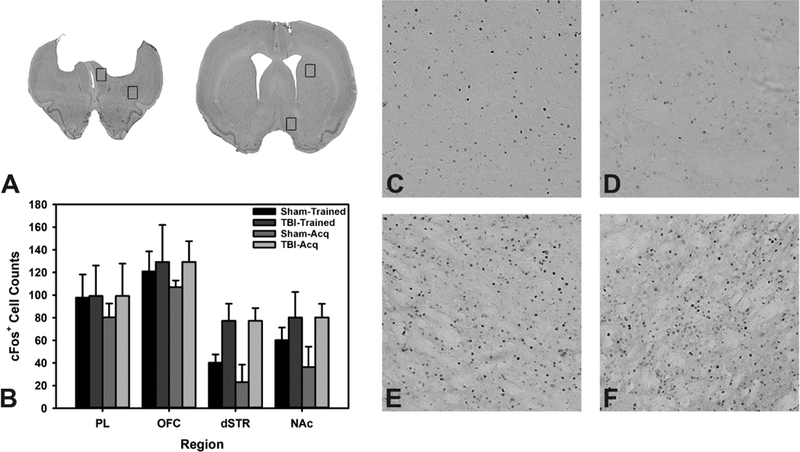
Analysis of cFos positive cells. A) Cresyl-violet of representative injured brain with boxes over regions of interest. B) Quantification of cFos positive cells. C) Exemplar sham dSTR. D) Exemplar sham NAc. E) Exemplar TBI dSTR. F) Exemplar TBI NAc. Data are mean + SEM.